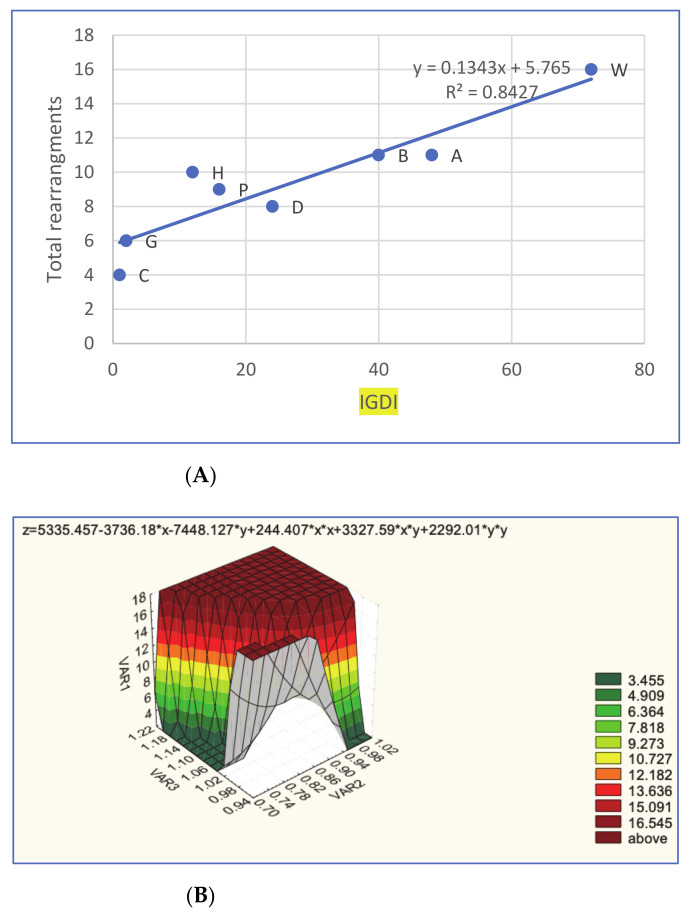
Figure 6.
Graphical representation for correlations between rearrangement/divergence characteristics in the eight avian genomes studied. Upper (A): Simple linear correlation between the integrative genome/divergence index (IGDI; see details in Supplementary Note 1) and total rearrangements: C, chicken; G, helmeted guinea fowl; D, mallard duck; P, pigeon; H, houbara bustard; B, common blackbird; A, Atlantic canary; and W, Eurasian woodcock. Lower (B): Multiple correlation 3D surface plot (see details in Supplementary Note 1) for total number of rearrangements (VAR1), fluorescence in situ hybridisation (FISH) success rate (VAR2) and ratio of diploid number of chromosomes to the typical avian karyotype (2n/80; VAR3) across the eight avian species studied.

