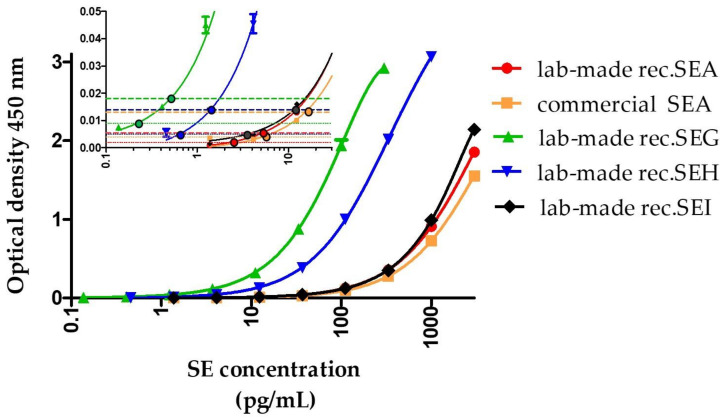
Figure 2.
Representative standard curves obtained with each of the best sandwich enzyme immunoassays for the detection of SEA, SEG, SEH, or SEI using the 3-h sequential format. Dilutions of target toxins in EIA buffer were detected using the best-identified sandwich immunoassay (Table 3) using the 3-h sequential format with poly-horseradish peroxidase-labeled streptavidin detection. The insert shows the low concentration part of the curve. Colored spherical points indicate the theoretical limit of detection (LoD) and limit of quantification (LoQ) for each sandwich immunoassay. Colored thin dotted and dashed horizontal lines represent optical densities reached for the detection limit (signal greater than nonspecific binding + three standard deviations) and quantification limit (signal greater than nonspecific binding + 10 standard deviations), respectively. Error bars represent standard deviations from the duplicate.

