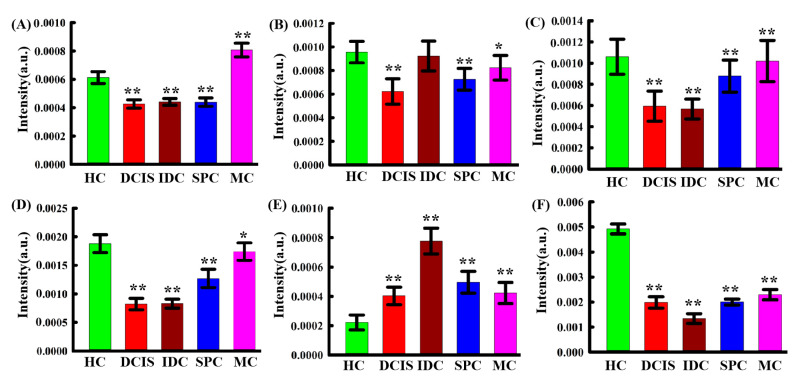
Figure 3.
Bar graphs showing variations in the intensity of spectral peak corresponding to various biochemical components in HC, IDC, DCIS, SPC, and MC samples. The mean ± standard deviation is indicated. (A) Collagen (868 cm−1), (B) lipid (1267 cm−1), (C) lipid (1302 cm−1), (D) lipid (1440 cm−1), (E) protein (1608 cm−1), (F) lipid (2890 cm−1). Statistical signifificance was determined by one-way ANOVA followed by a Tukey’s HSD post-hoc test. Asterisks indicate levels of signifificance, * p < 0.05, ** p < 0.01.

