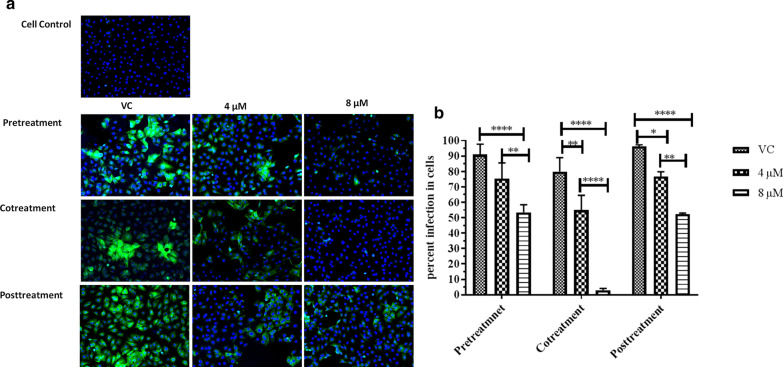
Fig. 2.
Immunoflouresce assay a immunoflourescent images of CHIKV infected Vero E6 cells under pre-treatment, posttreatment and cotreatment conditions. Virus infected cells appear green in colour; b percentage of infected Vero E6 cells in cultures infected with virus pretreated, cotreated and posttreated with different concentrations of α-Mangostin. Cells were counted in three different fields to obtain the percent infected cells. All the values are expressed as mean ± SD. The experiments were performed in triplicates in three independent trials. ***p < 0.001; **p < 0.01 and *p < 0.05 vs. vehicle control

