Fig. 6.
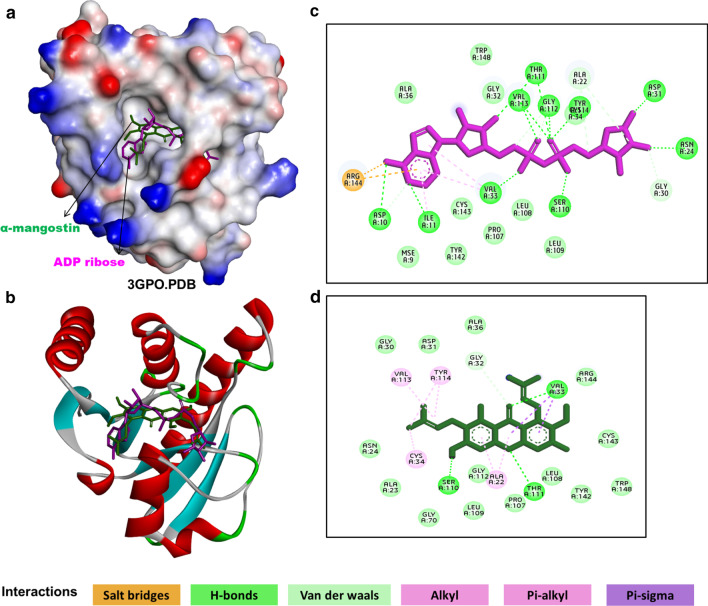
Molecular interactions of α-Mangostin with CHIKV nsP3 macrodomain (3GPO.pdb). a Solvent surface view (colored by interpolated charge with a probe radius of 1.8 Å), b ribbon view depicting superimposition of re-docked pose of ADP-ribose (represented in a pink stick model) and docked pose of α-Mangostin (green stick model) in the nsP3 macrodomain cavity, c 2-dimensional interaction diagram of co-crystallized ADP-ribose with nsP3 macrodomain, d 2-dimensional interaction diagram of α-Mangostin with nsP3 macrodomain. Different types of interactions are represented by different colours mentioned in interactions colour panel. All interactions are visualised and analysed using Biovia Discovery studio client 2017

