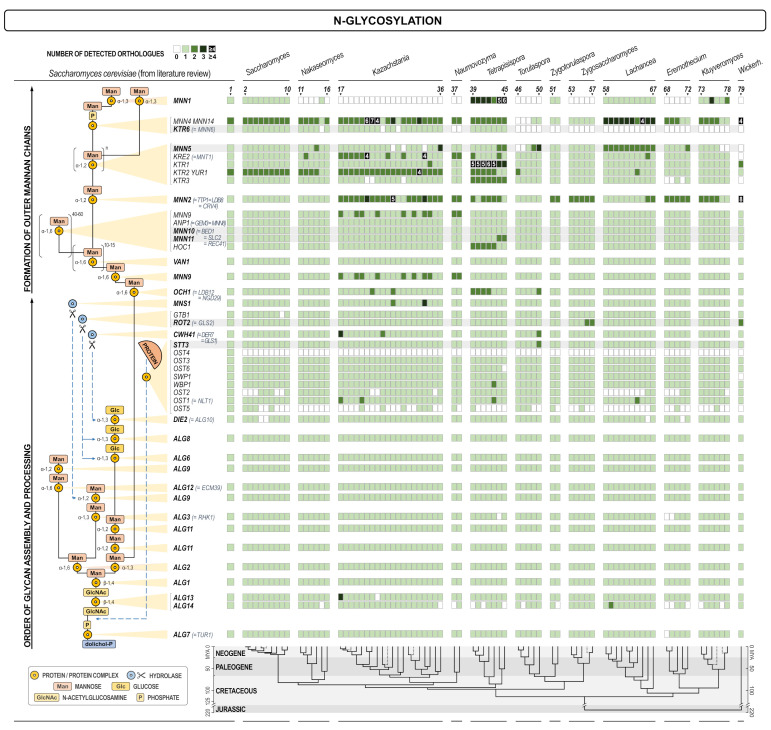
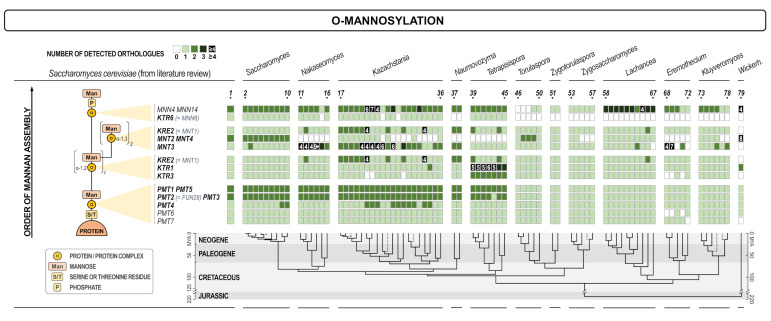
Figure 1.
Heat map of orthologues of S. cerevisiae genes involved in protein glycosylation. Every gene is presented in one row, while every yeast is presented in one line. Compared yeasts are: 1. Saccharomyces (S.) cerevisiae in SGD; 2. S. cerevisiae re-annotated; S. cerevisiae var. boulardii; 4. S. paradoxus; 5. S. mikatae; 6. S. jurei; 7. S. kudriavzevii; 8. S. arboricola; 9. S. uvarum; 10. S. eubayanus; 11. Candida (C.) nivariensis; 12. Nakaseomyces (Na.) delphensis; 13. C. bracarensis; 14. C. glabrata; 15. Na. bacillisporus; 16. C. castellii; 17. Kazachstania (Ka.) solicola; 18. Ka. aerobia; 19. Ka. servazzii; 20. Ka. unispora; 21. Ka. siamensis; 22. Ka. transvaalensis; 23. Ka. yakushimaensis; 24. Ka. taianensis; 25. Ka. naganishii; 26. Ka. telluris; 27. Ka. bromeliacearum; 28. Ka. intestinalis; 29. Ka. martiniae; 30. Ka. turicensis; 31. Ka. saulgeensis; 32. Ka. kunashirensis; 33. Ka. spencerorum; 34. Ka. rosinii; 35. Ka. africana; 36. Ka. viticola; 37. Naumovozyma (Nau.) dairenensis; 38. Nau. castellii; 39. Tetrapisispora (Te.) namnaonensis; 40. Te. fleetii; 41. Te. phaffii; 42. Te. iriomotensis; 43. Vanderwaltozyma polyspora; 44. Te. blattae; 45. Yueomyces sinensis; 46. Torulaspora (To.) franciscae; 47. To. pretoriensis; 48. To. delbrueckii; 49. To. maleeae; 50. To. microellipsoides; 51. Zygotorulaspora (Zyt.) florentina; 52. Zyt. mrakii; 53. Zygosaccharomyces (Zys.) bisporus; 54. Zys. bailii; 55. Zys. kombuchaensis; 56. Zys. mellis; 57. Zys. rouxii; 58. Lachancea (L.) lanzarotensis; 59. L. meyersii; 60. L. dasiensis; 61. L. nothofagi; 62. L. quebecensis; 63. L. thermotolerans 64. L. waltii; 65. L. mirantina; 66. L. fermentati; 67. L. kluyveri; 68. Eremothecium (E.) gossypii; 69. Ashbya aceri; 70. E. cymbalariae; 71. E. coryli; 72. E. sinecaudum; 73. Kluyveromyces (Kl.) lactis; 74. Kl. dobzhanskii; 75. Kl. marxianus; 76. Kl. wickerhamii; 77. Kl. nonfermentans; 78. Kl. aestuarii; 79. Wickerhamomyces anomalus. The scheme of the cellular process with the site in which certain gene is involved is shown on the left. The intensity of the color of every square is proportional to the number of orthologues found as depicted in the inset legend. White square means no orthologue has been found. The lower part of the figure presents the evolutionary chronogram of each species. Genes coding for catalytic subunits are presented in bold and have a grey background if they are parts of a bigger complex.


