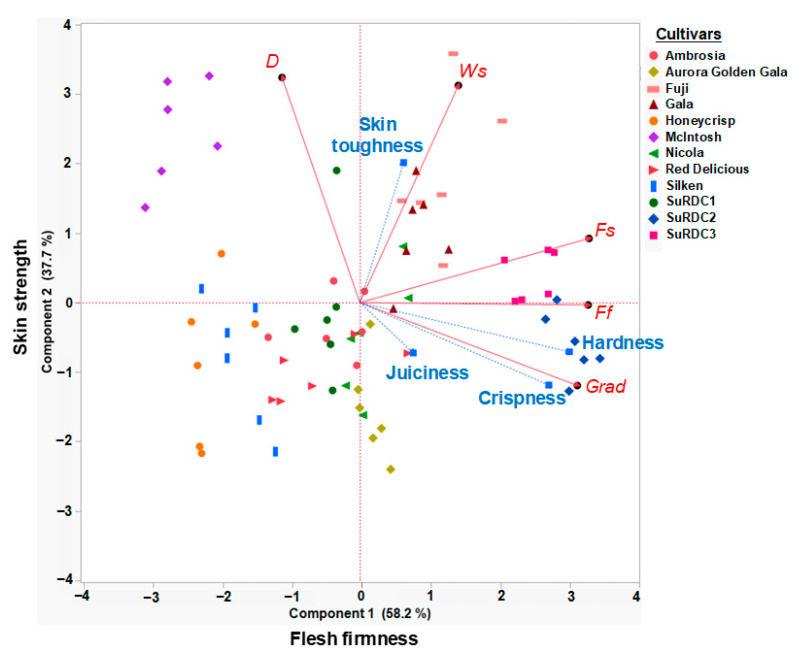
Figure 2.
Principal component analysis biplot calculated using standardized mean values of five TA.XTplus Texture Analyzer parameters (Fs, Ws, Grad, D, and Ff). Instrumental measurements, as described in Table 1, are identified by red lines. Apple cultivars are identified with symbols of unique colors and shapes. Sensory textural attributes (crispness, hardness, juiciness, and skin toughness) are identified by blue lines, and positioned on this plot using correlation analysis (see Section 2.5).

