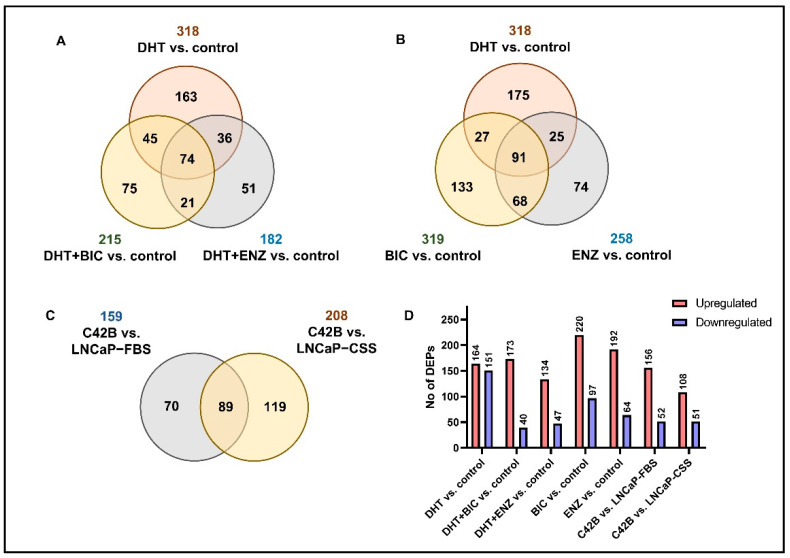
Figure 1.
Summary of the SWATH-MS proteomic analysis. (A) The number of DEPs overlapped between DHT, DHT + BIC and DHT + ENZ treatments compared to control treatment. (B) The number of DEPs identified in DHT, BIC and ENZ treatments compared to control treatment. (C) The number of DEPs overlapped between C4-2B vs. LNCaP-FBS and C4-2B vs. LNCaP-CSS. (D) The bar chart represents the number of upregulated and downregulated DEPs in all treatment comparisons.

