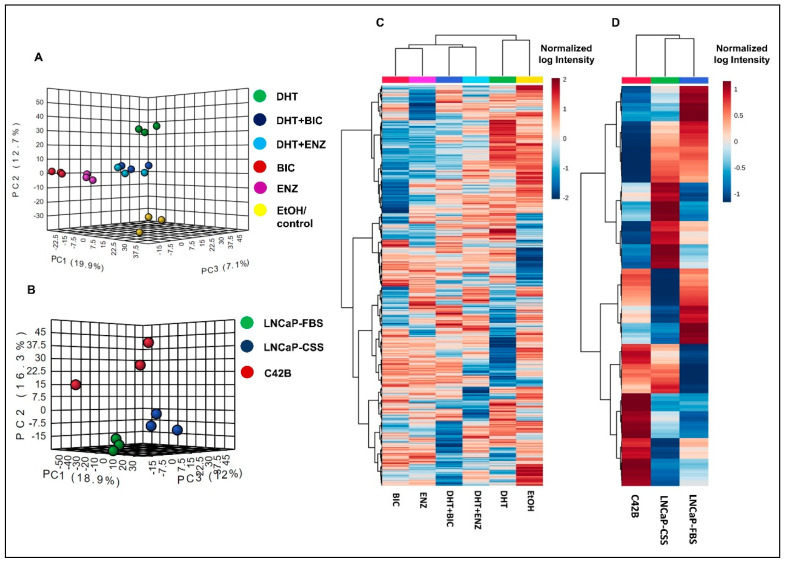
Figure 2.
Proteomic profiles in LNCaP cells with response to androgen/anti-androgen treatment. The graph demonstrates the 3D principal component scores plot for the proteomic profiles of (A) androgen and anti-androgen treated LNCaP cells and (B) C4-2B and LNCaP cells. Hierarchical clustering analysis of (C) androgen and anti-androgen treated LNCaP cells and (D) C4-2B and LNCaP cells. For the Heatmap visualization, normalized SWATH areas were clustered based on Ward algorithm, and row/column orders were set by applying a hierarchical clustering based on Euclidean distance.

