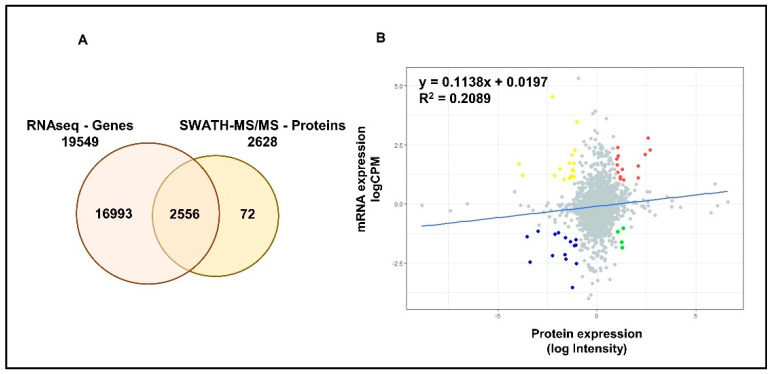
Figure 3.
Correlation between mRNA and protein expression in LNCaP cells. (A) Venn diagrams demonstrate the number of genes identified by RNAseq and SWATH-MS analysis of LNCaP cells. A total of 2556 common elements were identified by both experiments. (B) Scatter plot represent the correlation between protein expression measured as log Intensity and respective mRNA expression measured as log counts per million (CPM) in LNCaP cells. R2 value indicates the variability between the mRNA and protein expressions. Slope indicates the linear regression coefficient. Red: Genes showing high mRNA and high protein expressions; Blue: Genes showing low mRNA and low protein expressions; Yellow: Genes showing high mRNA and low protein expression; Green: Genes showing low mRNA and high protein expression.

