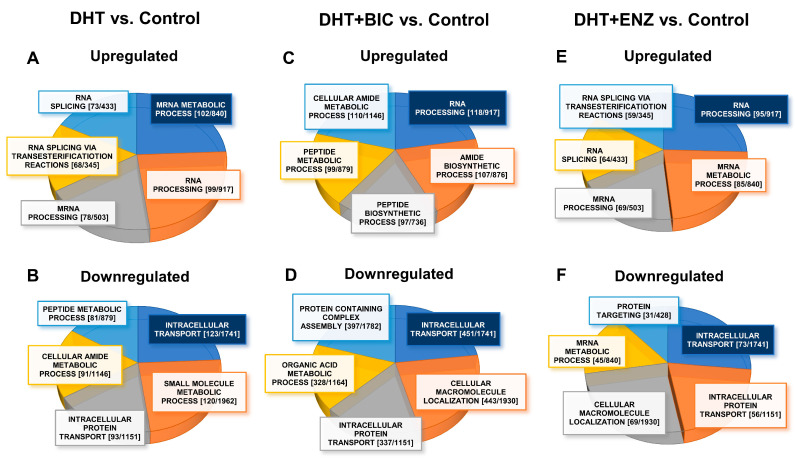
Figure 5.
GO-biological processes overrepresented by the proteins up-/down-regulated in response to androgen and anti-androgen treatment. The pie charts represent the GO-biological processes significantly dysregulated (FDR/q < 0.05) in DHT treatment: (A) upregulated (B) downregulated; DHT + BIC treatment: (C) upregulated (D) downregulated; and DHT + ENZ treatment: (E) upregulated (F) downregulated, compared to control treatment. Highlighted (Blue) biological process represent the most significantly dysregulated GO-biological process. The size of each section represents the associated number of proteins associated for each GO biological process. Each GO-biological process is given with [the number of DEPs (k)/number of molecules GO-BP gene set (K)].

