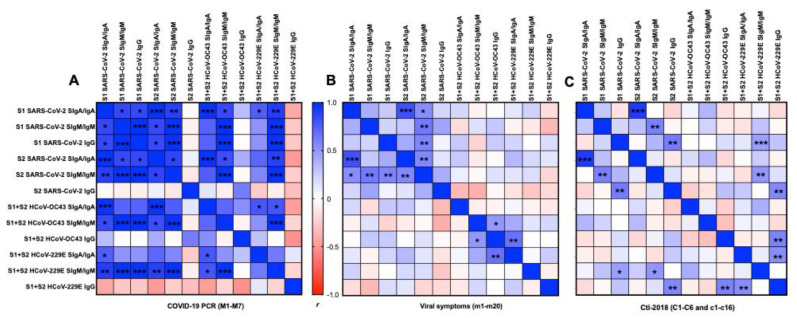
Figure 5.
Matrix correlations between the type of antigens (S1 or S2 subunit SARS-CoV-2, S1 + S2 HCoV-OC43, and HCoV-229E) and the type of isotypes (secretory SIgA (SIgA)/IgA, secretory SIgM (SIgM)/IgM, or IgG) in human milk. (A) Mothers with confirmed COVID-19 PCR (n = 7) and (B) mothers with previous viral symptoms during COVID-19 pandemic (n = 20), and (C) unexposed mothers (n = 22, for Ctl1-2018 (n = 6) and for Ctl2-2018 (n = 16), pre-pandemic). Positive correlations are in blue and negative correlations are in red for Pearson’s correlation coefficients values (r). Asterisks show statistically significant differences between variables (*** p < 0.001, ** p < 0.01, and * p < 0.05) using matrix correlation (two-tailed and 95% of confidence interval).

