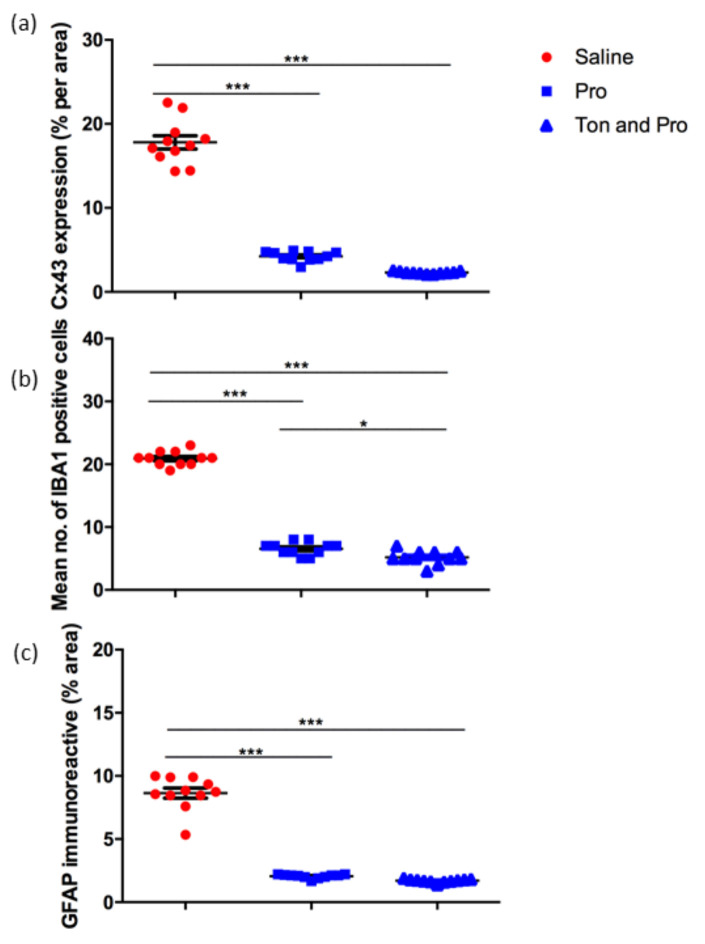
Figure 5.
Quantification of Cx43 expression (a), mean number of Iba-1 positive cells/unit area (b) and GFAP immunoreactivity (c) in the saline, probenecid alone, tonabersat and probenecid combination treatment groups. Analysis revealed a significant decrease in Cx43, Iba-1 and GFAP in the treatment groups (a–c). The tonabersat and probenecid combination group further showed significantly fewer microglia compared to the probenecid group (b). Statistical analysis was conducted using one-way ANOVA, followed by Tukey’s multiple comparisons test. Significant values in comparison with results from the saline group are indicated with asterisks: *p < 0.05; ***p <0.001.

