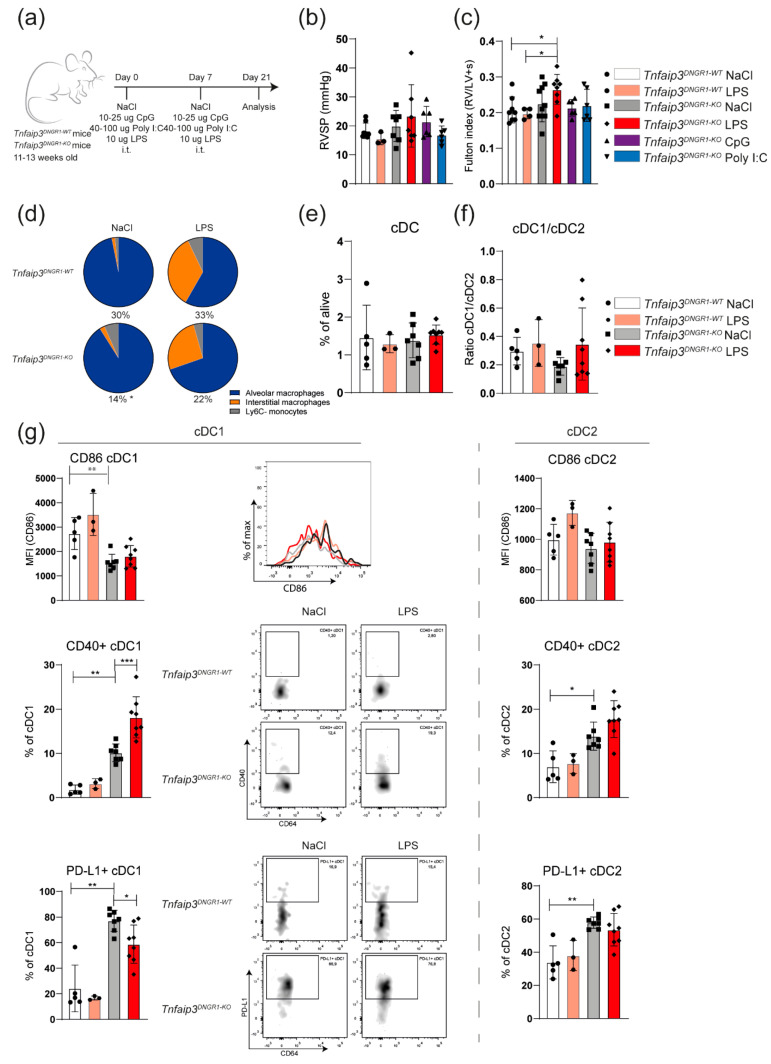
Figure 2.
TLR4 activation leads to RV hypertrophy and cDC1 phenotype changes in Tnfaip3DNGR1-KO mice. (a) Scheme of intratracheal (i.t.) administration of CpG, lipopolysaccharide (LPS) and polyinosinic-polycytidylic acid (Poly I:C) in WT and Tnfaip3DNGR1-KO mice on day 0 and 7, and analysis on day 21; (b) right ventricular systolic pressure (RVSP) in toll-like receptor (TLR)-exposed WT and Tnfaip3DNGR1-KO mice, determined by right heart catheterization; (c) hypertrophy of RV measured by Fulton index (right ventricle/ left ventricle + septum); (d) assessment of the indicated cell types in LPS-exposed WT and Tnfaip3DNGR1-KO mice. Proportion of the CD64+GR1− macrophage/monocyte population from total alive cells is indicated below the pie charts; (e,f) quantification of total DCs (e) and the CD103+ cDC1/CD11b+ cDC2 subset ratio (f) in the lungs of the indicated mice, as determined by flow cytometry; (g) quantification of surface CD86, CD40 and PD-L1 expression on CD103+ cDC1s (left) and CD11b+ cDC2s (right) in the indicated mouse groups. Flow cytometry analyses are shown as histogram overlays of CD86 expression (top), as dot plots with CD64/CD40 profiles (middle) and dot plots with CD64/PD-L1 profiles (bottom) of gated cDC1s. Results are presented as mean values + standard deviation of 3–10 mice (b,c) or 3–6 (e–g) mice per group. MFI = median fluorescence intensity. * p < 0.05, ** p < 0.01, *** p < 0.001.

