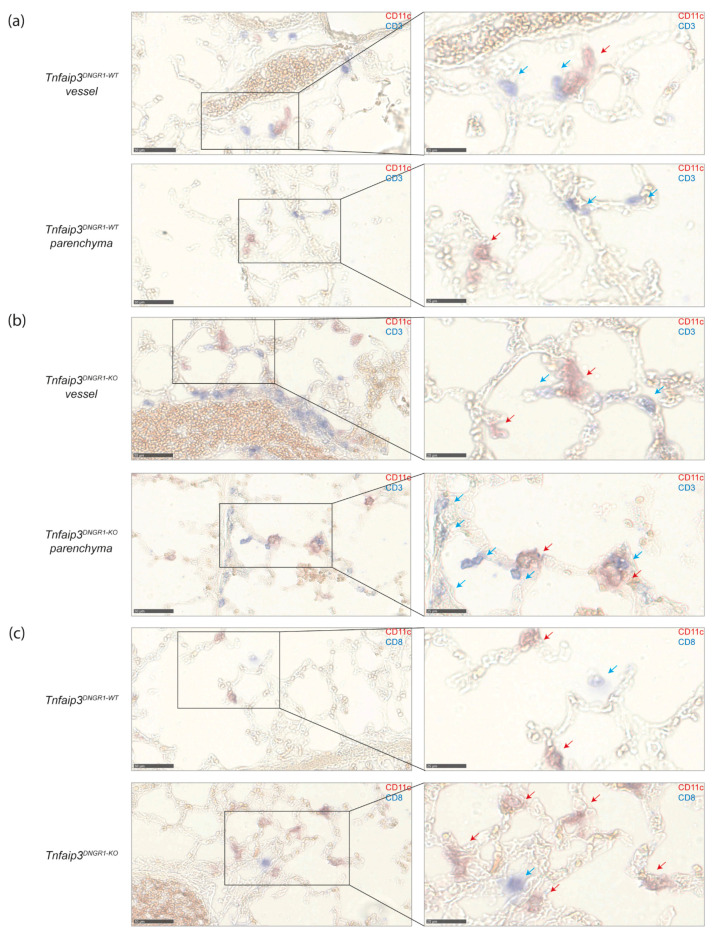
Figure 4.
DCs and T cells are more often in close proximity around vessels and in parenchyma in Tnfaip3DNGR1-KO mice. (a) DC (CD11c, red) and T cell (CD3, blue) staining on lung cryosections of 31-week-old WT mice of which an area around a vessel (top) and parenchyma (bottom) of the same mouse is depicted. Magnification of selected areas (right); (b) DC (CD11c, red) and T cell (CD3, blue) staining on lung cryosections of 31-week-old Tnfaip3DNGR1-KO mice of which an area around a vessel (top) and parenchyma (bottom) of the same mouse is depicted. Magnification of selected areas (right); (c) DC (CD11c, red) and CD8+ T cells (CD8, blue) of WT (top) and Tnfaip3DNGR1-KO (bottom) mice around a vessel. Magnification of selected area (right). Data shown are representative for 4–6 mice per group. Scale in left panels is 50 µm and of right panels 25 µm. Blue arrows indicate T-cells, and red arrows indicate DCs in the larger magnification (right panels).

