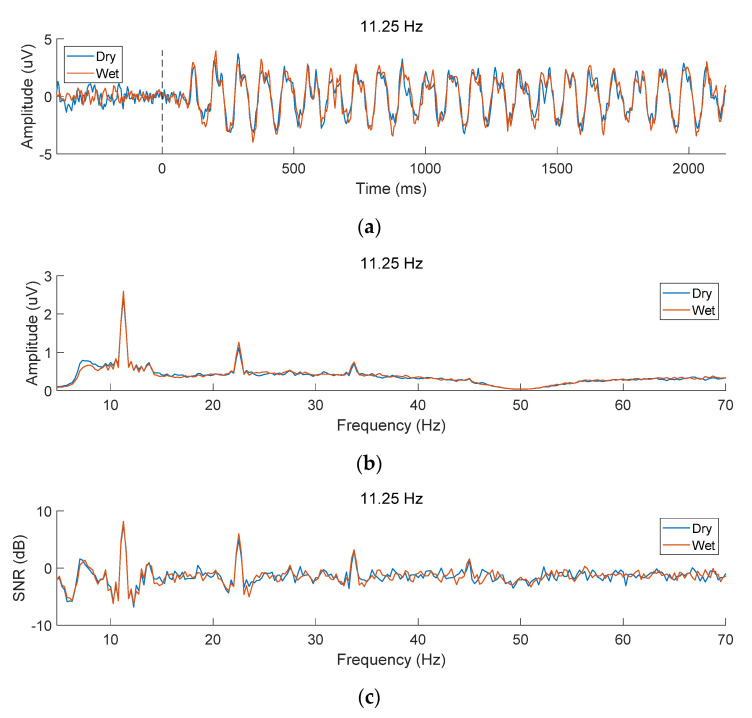
Figure 4.
(a) Time-domain waveform, (b) amplitude spectrum, and (c) SNR of EEG signals recorded with dry and wet electrodes. SSVEPs at 11.25 Hz from the Oz channel were averaged across all subjects and all blocks. The black dashed line at horizontal axis 0 in the subfigure (a) represents the stimulus onset of the 2 s visual stimulation.

