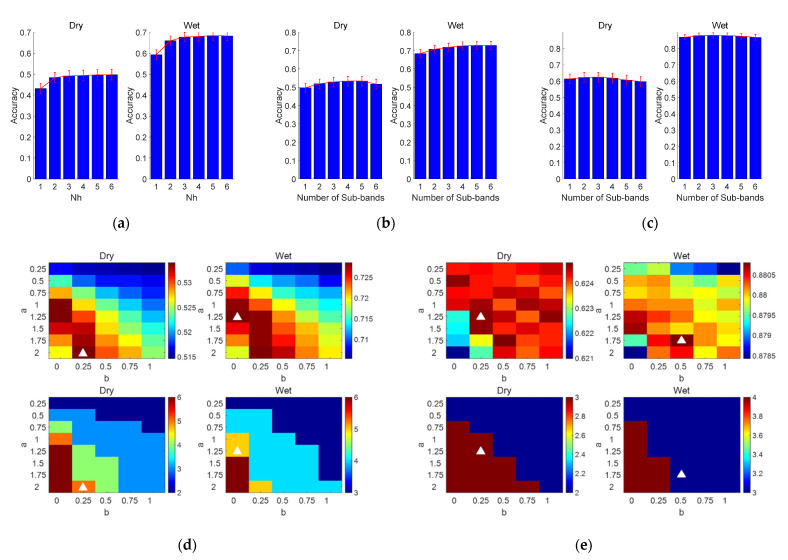
Figure 6.
(a) In the standard CCA method, the classification accuracy of the different harmonics at 1 s data length. Classification accuracy at different values (from 1 to 6 with a step of 1): (b) FBCCA, (c) FBTRCA. The weight vector w (i.e., and ) and the number of sub-bands corresponding to the maximum classification accuracy optimized by the grid search method: (d) FBCCA, (e) FBTRCA. The error bars in (a–c) represent the standard errors. In (d,e), the color bar in the top two subgraphs represents the classification accuracy, while the color bar in the bottom two subgraphs corresponds to the number of sub-bands N.

