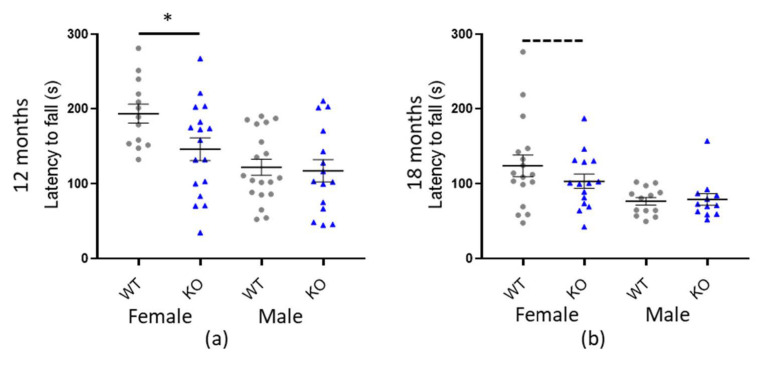
Figure 4.
Macrod1 KO is associated with sex specific reduced fall latency on the rotarod. Graphs show individual values dot plot, separated by sex and cohort, WT shown in grey circles and Macrod1 KO in blue triangles. Error bars are the SEM. Graphs are as follows, (a,b) Macrod1 aged 12 and 18 months. Significant difference for Macrod1 KO 12 months; F(1,27) = 14.53, * p = 0.005 and trending at 18 months; F(1,29) = 3.11, p = 0.089 (ANCOVA).

