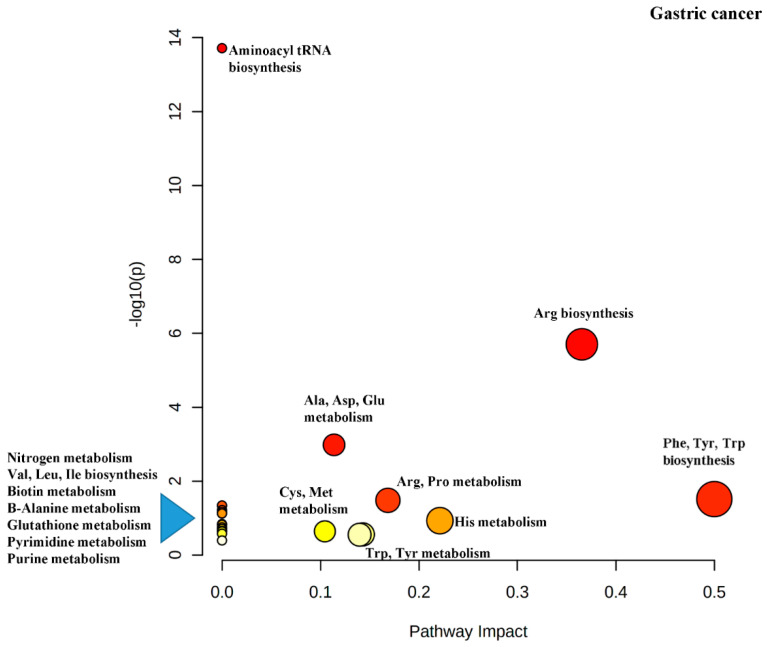
Figure 4.
Pathway analysis performed using the altered metabolites from metabolomics data for gastric cancer. Each filled circle corresponds to a metabolic pathway. The x-coordinate (Pathway Impact) indicates the extent of pathway influence by the perturbed metabolites. The point size is related to the diversity of the pathway, based on the number of metabolites contained in the pathway. The ordinate represents the negative logarithm of the p-value obtained from the enrichment analysis done by the MetaboAnalyst software. The p-value (measure of pathway importance) is encoded in the color of the circles with red being the highest p-value.

