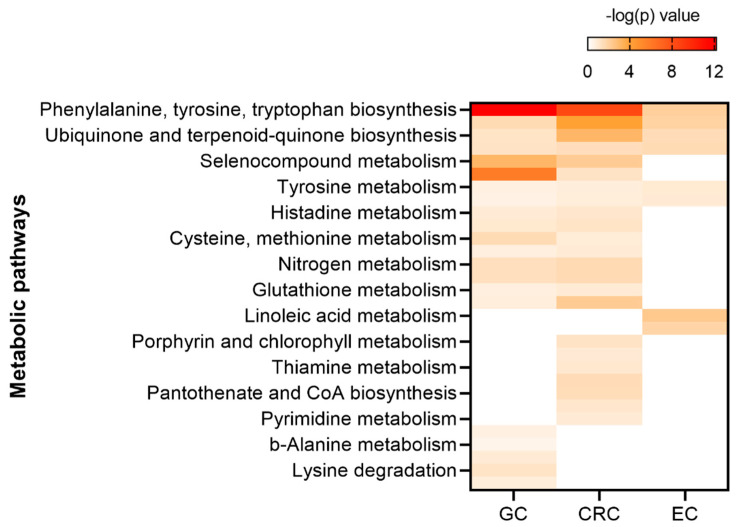
Figure 7.
Comparison of the altered metabolic pathways for GC, EC and CRC. The metabolites demonstrated in Table 9 were uploaded to map to KEGG metabolic pathways for over-representation analysis and pathway topology analysis. −log(p) value represents the relevance and weight.

