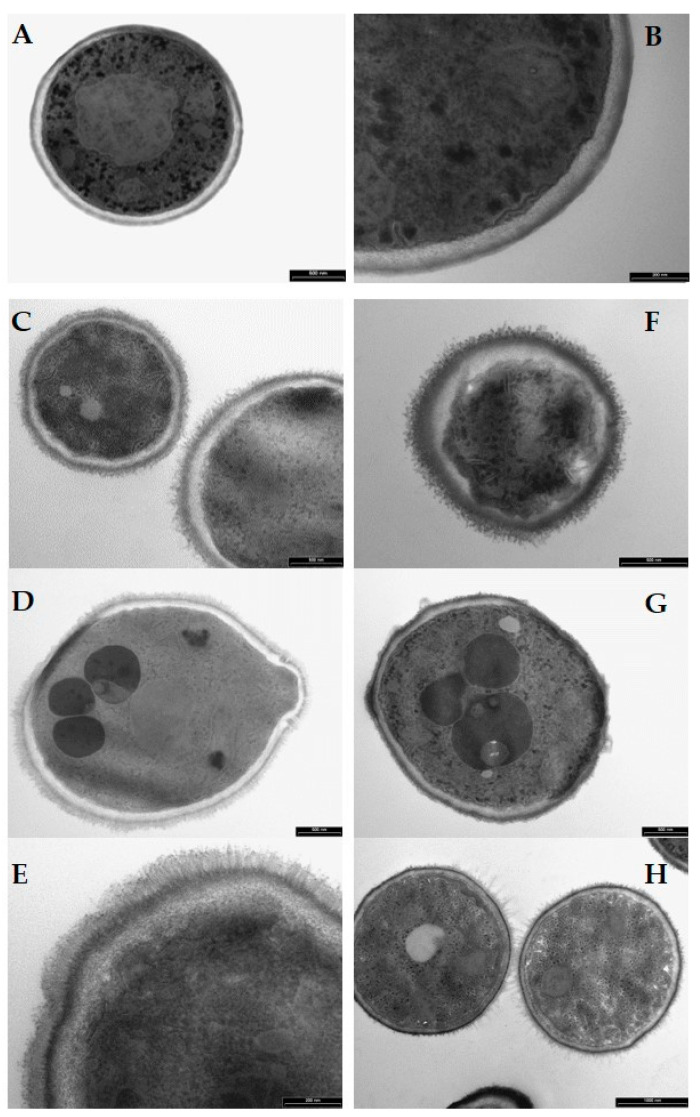
Figure 13.
Transmission electron microscopy images of Candida albicans cells treated for 60 min with selected KP-derivatives. (A,B): untreated (control) cells. (C–E): H10S-treated cells. (F–H): K10S-treated cells. Yeast cells treated with H10S and K10S (250 µM) revealed structural and morphological alterations. Bars = 500 nm (A,C,D,F,G), 1000 nm (H), 200 nm (B,E).

