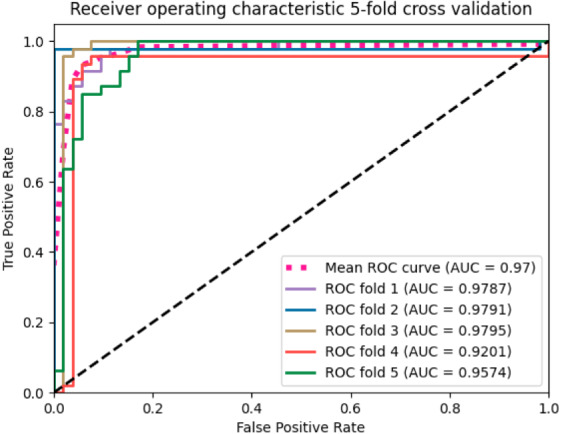
Figure 2. The ROC curves of the SVM classifier.

The curves were generated based on the true positive rate (y-axis) vs. the false positive rate (X-axis). The area under the curve (AUC) represented the efficacy of the method.

The curves were generated based on the true positive rate (y-axis) vs. the false positive rate (X-axis). The area under the curve (AUC) represented the efficacy of the method.