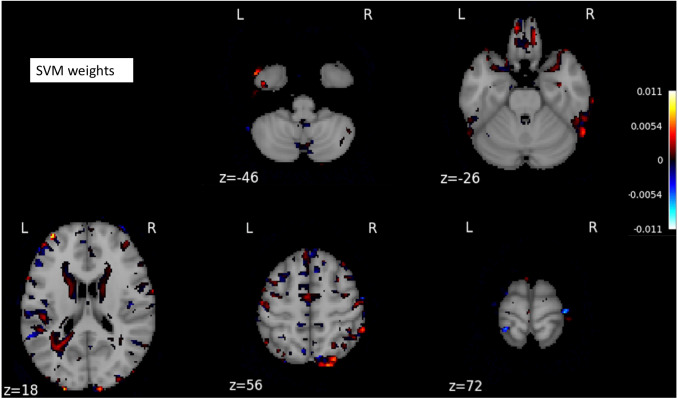
Figure 3. A structure scan in axial slices at different z levels.
Projecting the weight vector back to an MR image yielded a map of the most discriminating regions between AD and CN (cognition normal). The highlighted red and blue regions represent the most discriminating regions in the original space, according to the SVM model learned from our dataset. The size of the MNI template used in visualization was 182 × 218 × 182.

