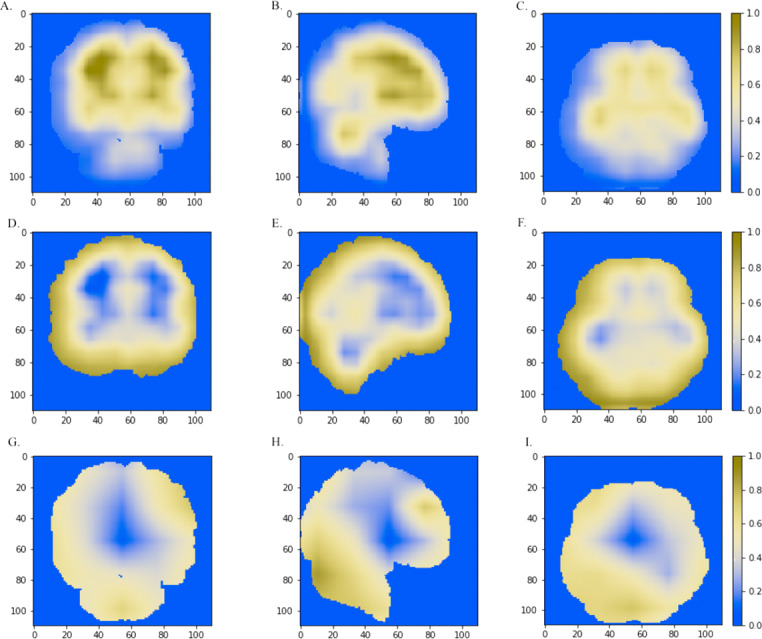
Figure 5. The horizontal (x = 50), sagittal (y = 50), and coronal (z = 50) view of the brain MRI and visual explanation heatmaps generated from 3D-ResNet (A–F) and 3D-VGGNet (G, H, I).

The white matter region, the cerebral cortex and cerebellum were highlighted as shown in (A, B, C), (D, E, F) and (B, G, H, I), respectively. The size of the MNI template used in visualization was 110 × 110 × 110 and the coordinates in the other two dimensions were shown in the figure axes.
