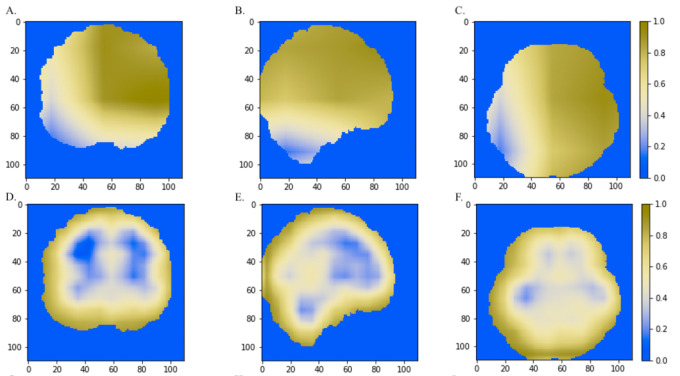
Figure 6. The comparisons of discriminative regions heatmaps in horizontal (x = 50), sagittal (y = 50), and coronal (z = 50) views of the brain MRI.
The heatmaps generated by Grad-CAM based on 3D-ResNet were shown in A, B and C, whereas the ones based on 3D-VGGNet model were shown in D, E and F. The size of the MNI template used in visualization was 110 × 110 × 110 and the coordinates in the other two dimensions were shown in the figure axes.

