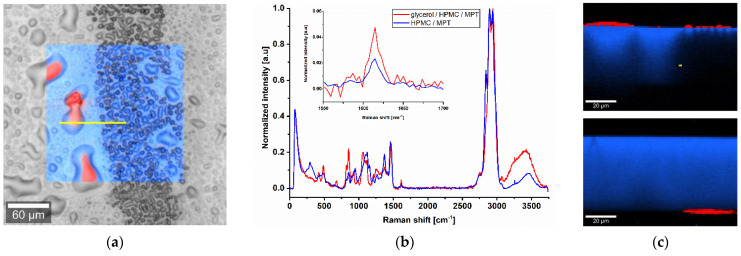
Figure 5.
Raman microscope images of ODF imprinted by I7. (a) Surface scan with an area of 200 × 200 µm, spatial resolution of 1 µm and 0.05 s exposure time. (b) Average normalised Raman spectra of the surface scan with magnified characteristic MPT peak at 1615 cm−1. (c) Depth scan of the cross-section from top and bottom side of the ODF with an area of 100 × 70 µm along the yellow line in (a), spatial resolution of 1 µm and 0.2 s exposure time. Red: mixture of glycerol, HPMC and MPT; blue: mixture of HPMC and MPT.

