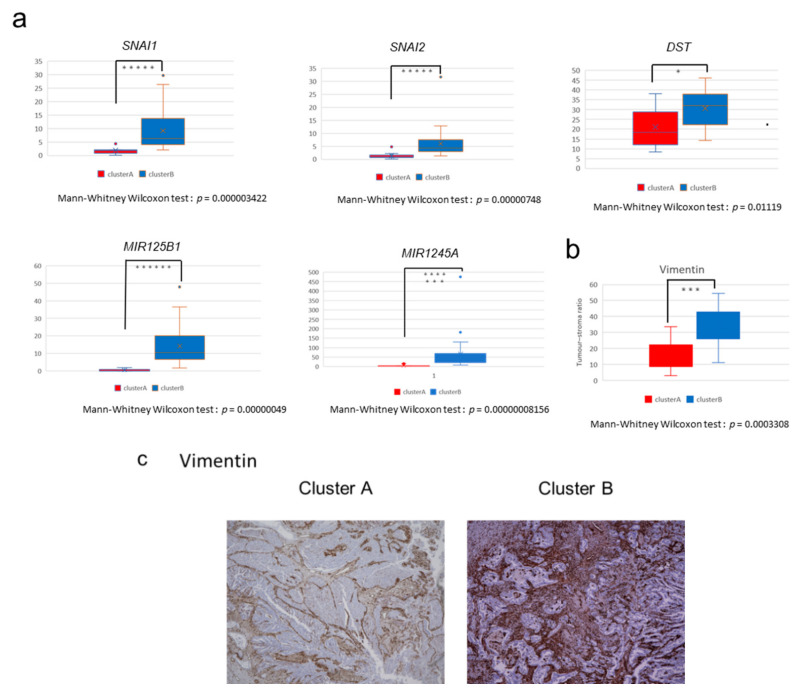
Figure 3.
Expression of stroma-related genes in GBCs. (a) Comparison of the expression of stroma-related genes (SNAI1, SNAI2, DST, miRNA125b1, and miRNA1245A) between the two clusters in fragments per kilobase of exon per million fragments mapped (FPKM; Mann–Whitney Wilcoxon test, p < 0.05). The y-axis shows FPKM of each gene. When p < 0.05, the asterisk increases with each zero digit; for example, *** for p < 0.0001. (b) Vimentin immunostaining. Ratio of the area of the positive cells/tumor cells was used to calculate stromal ratio in tumors (p = 0.0003308 by Mann–Whitney U test). (c) Vimentin immunostaining in the representative GBC tissues in Cluster A (left) and Cluster B (right). Positive cells are brown in color. Each sample was observed with a 4× objective lens.

