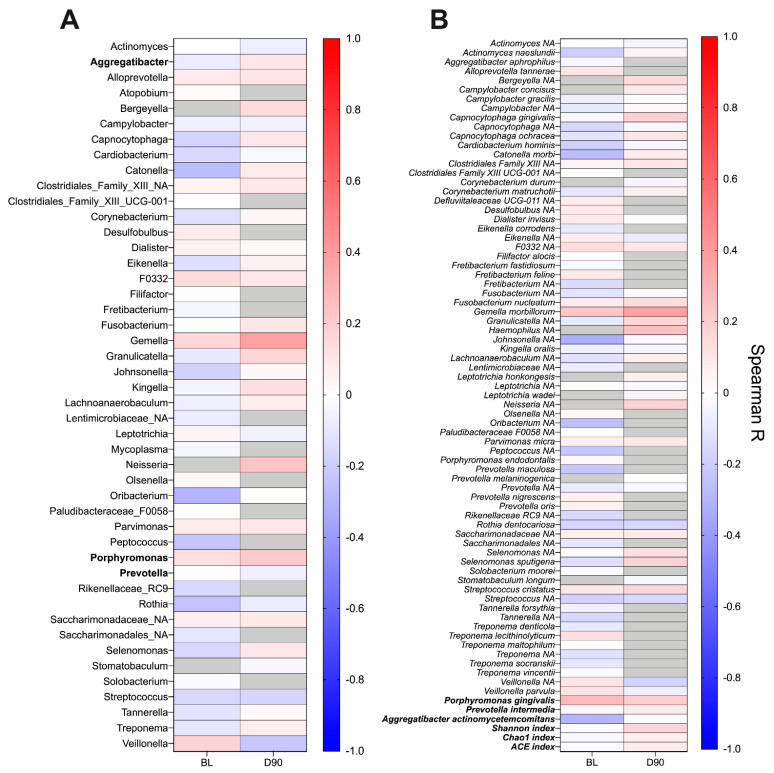
Figure 7.
Heatmap presenting correlations between the relative abundance of genera (A) and species (B) in the subgingival plaque and serum ACPA titre. Correlation analysis was performed at baseline (BL) and day 90 (D90) using Spearman–Rho. Genera and species were included if they were present in ≥50% of samples at each timepoint. Grey boxes indicate organisms not meeting this abundance threshold and were thus not included in the correlation analysis. In addition, post-hoc correlation analysis was performed using species of interest in this study and alpha-diversity indexes (bold). No significant correlations were observed at either timepoint.

