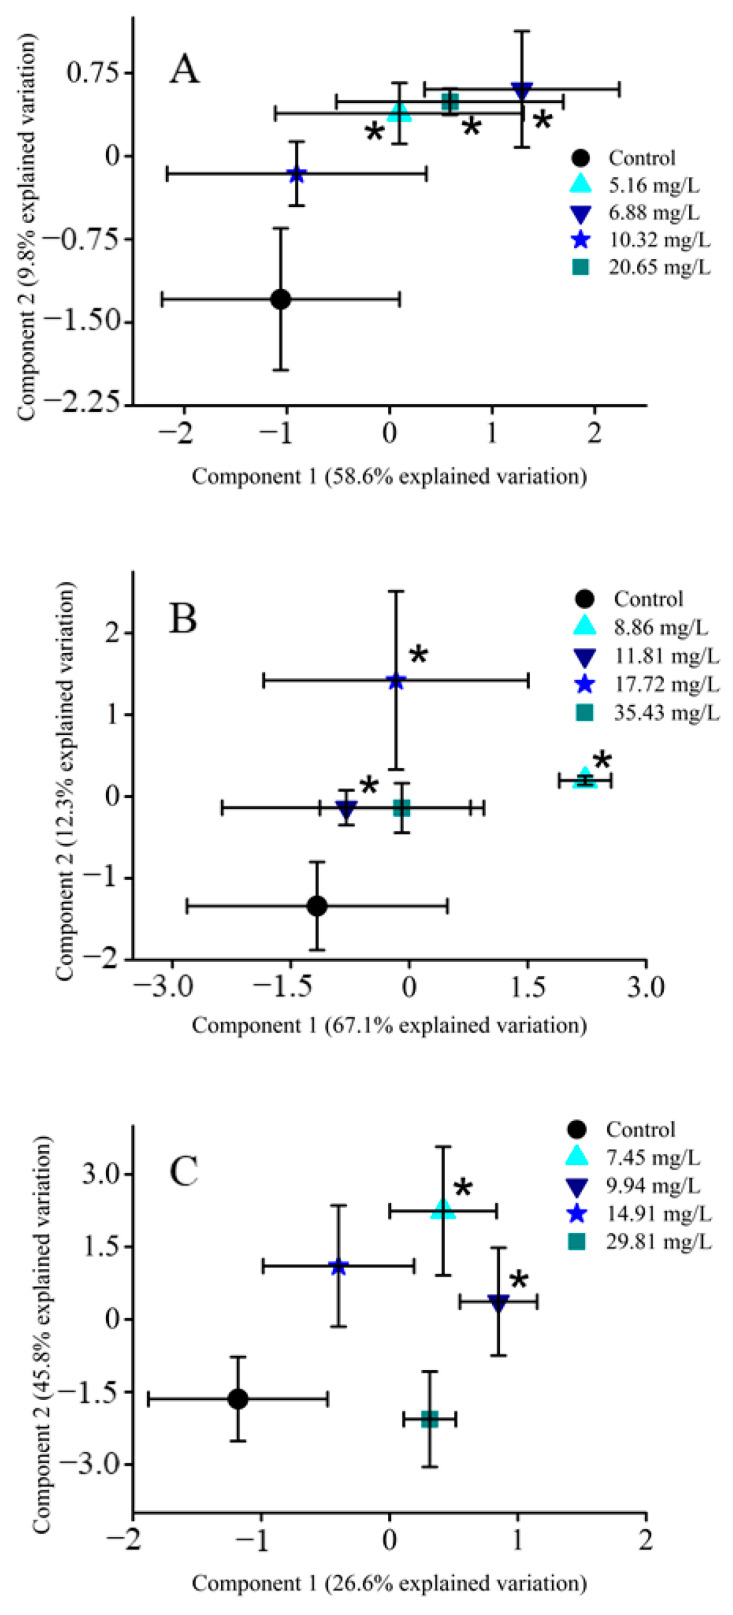
Figure 1.
Partial least squares-discriminant analysis (PLS-DA) scores plots of averaged (n = 12) metabolite data sets from all treatment groups. Statistical significance (p < 0.05) is outlined by the presence of an asterisk (*). (A) PLS-DA of DCAA exposure, (B) PLS-DA of TCAA exposure, (C) PLS-DA of DBAA exposure.

