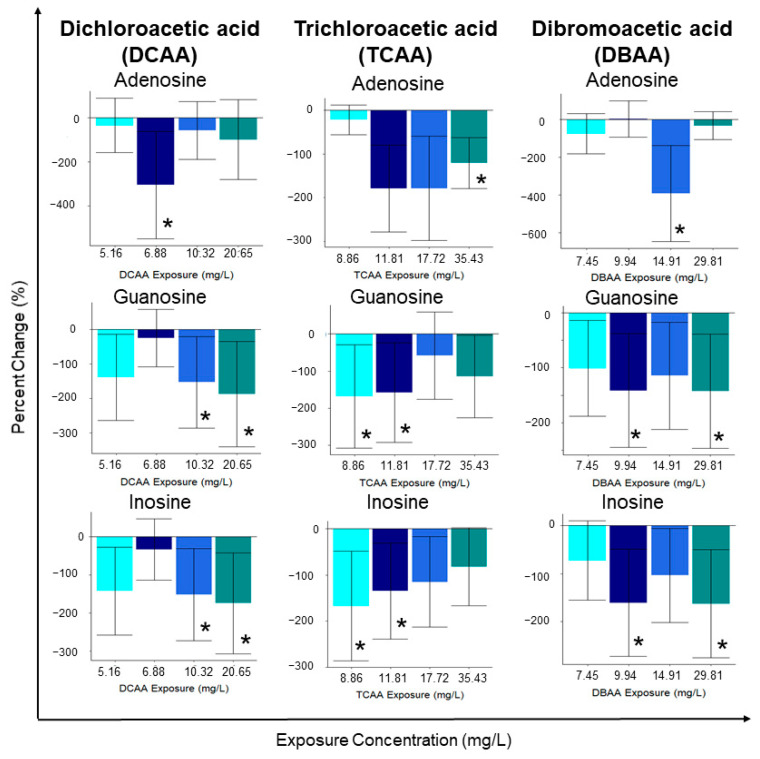
Figure 3.
Averaged (n = 12) individual metabolite percent changes following sub-lethal exposure to varying concentrations of DCAA exposure (5.16, 6.88, 10.32 and 20.65 mg/L), trichloroacetic acid (TCAA) exposure (8.86, 11.81, 17.72 and 35.43 mg/L) and dibromoacetic acid (DBAA) exposure (7.45, 9.94, 14.91 and 29.81 mg/L). Statistical significance (p < 0.05) was determined using a two-tailed, equal variance t-test and is outlined with the presence of an asterisk (*).

