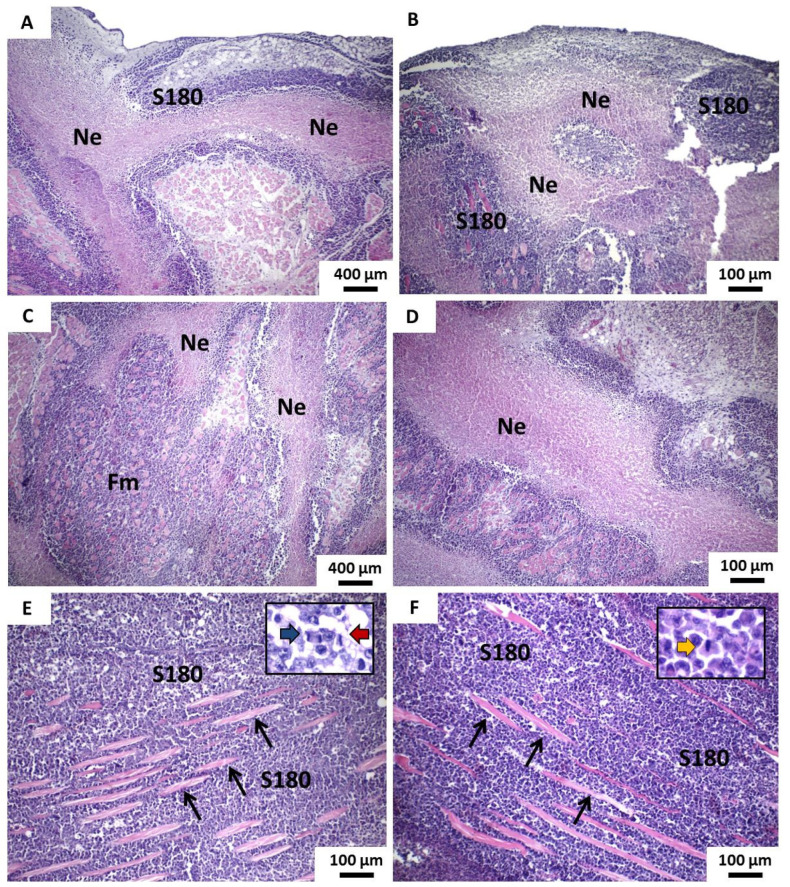
Figure 8.
Photomicrographs of HE stained histological sections show the main histopathological features of tumors developed in groups β-CD:POH (100 and 200 mg/Kg) from the implantation of S180 cells. (A,B) Irregular tumor boundaries and areas of peripheral coagulative necrosis and (C,D), as well as extensive blocks of necrosis in the most central areas of the tumor masses observed in groups β-CD:POH 100 mg/Kg and 200 mg/Kg, respectively (100×). (E) Intense dissociation of muscle fibers by tumor cells in both groups β-CD:POH 100 mg/Kg and (F) β-CD:POH 200 mg/Kg (100×). In the details, there are figures of mitosis in different phases of the cell cycle (400×). Legend: S180—Viable tumor cells of sarcoma 180; Coagulative necrosis; Thin black arrows—striated skeletal muscle fibers; Blue arrow—anaphase mitosis; Red arrow—metaphase mitosis; Orange arrow—prophase mitosis.

