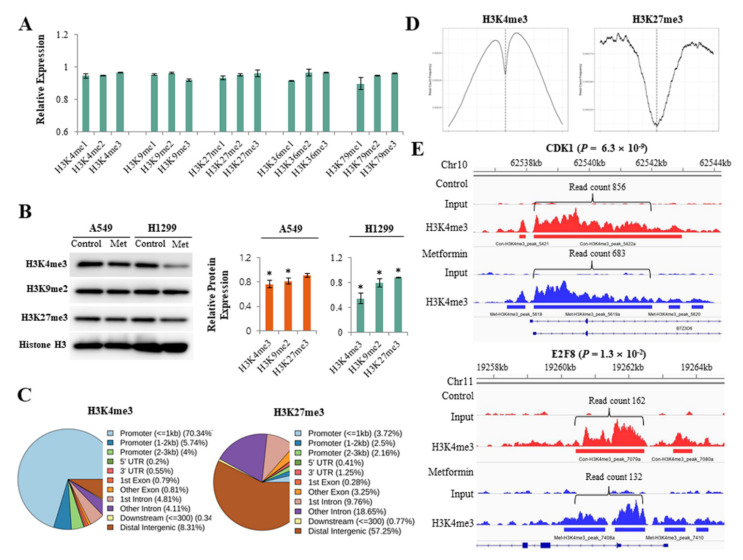
Figure 1.
Effects of metformin on histone H3 modifications. H1299 and A549 cells were treated with 5 mM metformin or left untreated as controls. (A) Global alterations in histone H3 methylations were analyzed using an enzyme-linked immunosorbent assay. The y-axis indicates the amounts of proteins in metformin-treated cells relative to untreated cells. Error bars indicate the standard deviation (n = 3). (B) Protein levels of H3K4me3, H3K9me2, and H3K27me3 were analyzed by western blotting. The bar graphs show the expression of three proteins in cells treated with 5 mM metformin relative to untreated cells. Error bars indicate the standard deviation (n = 3, * p < 0.05). The uncropped blots of (B) were shown in Figure S1. (C) The results from the ChIP-seq analysis show DNA regions in which H3K4me3 or H3K27me3 modification were enriched in response to metformin. (D) The read count frequency of H3K4me3 or H3K27me3 within the transcription start site (TSS) ± 3 kb is shown. (E) The images show ChIP-seq peaks of two representative genes whose H3K4m3 was reduced by metformin. Peaks indicate read count frequency.

