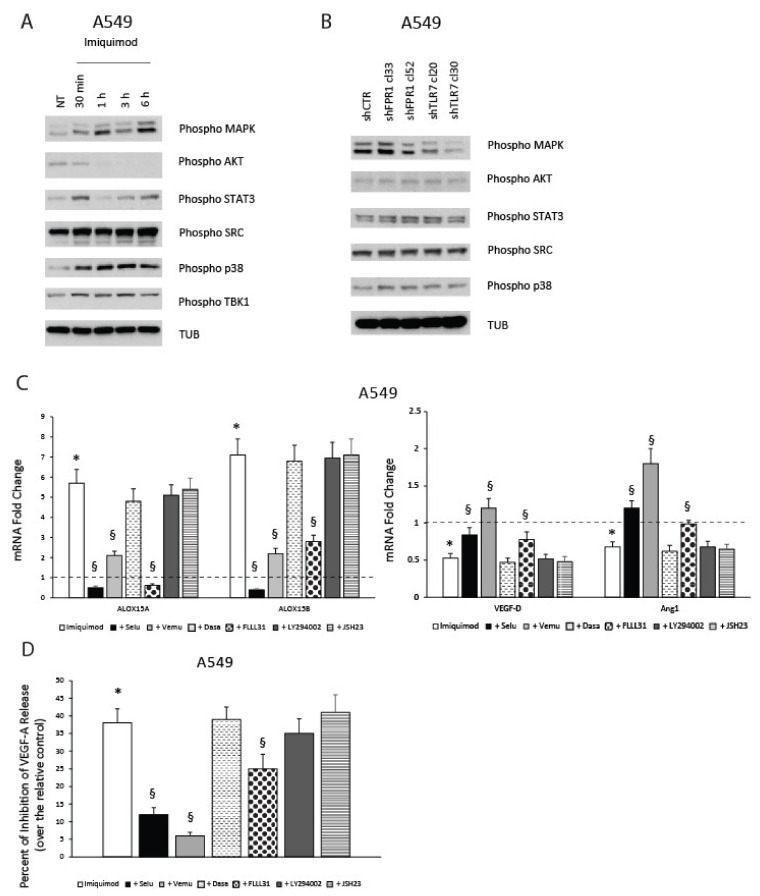
Figure 6.
Signaling pathways involved in anti-angiogenic and pro-resolving functions of TLR7. (A) Activation kinetics of MAPK, AKT, STAT3, SRC, p38, and TKB1 in A549 cells treated or not for the indicated time points with imiquimod (1 μg/mL), assessed by Western blot for their phosphorylated forms. α-tubulin (TUB) was used as a normalization marker. A representative experiment is shown. (B) Constitutive MAPK, AKT, STAT3, SRC, and p38 activation levels in A549 shCTR (a mass population), shFPR1 (clones 33 and 52), and shTLR7 (clones 20 and 30) assessed by Western blot for their phosphorylated forms. α-tubulin (TUB) was used as a normalization marker. A representative experiment is shown. (C) Effects of selumetinib (Selu)—MEK inhibitor 10 μM, vemurafenib (Vemu)—BRAF inhibitor 10 μM, dasatinib (Dasa)—SRC inhibitor 1 μM, FLLL31—STAT3 inhibitor 10 μM, LY294002—AKT inhibitor 15 μM, and JSH23—NF-kB inhibitor 5 μM on imiquimod-induced modulation of ALOX15A, ALOX15B, VEGF-D, and Ang1 mRNA expression. Data are represented as mean ± SD of three independent experiments. * p < 0.05 compared to untreated cells (dotted line). § p < 0.05 compared to imiquimod-treated cells. (D) Effects of selumetinib—MEK inhibitor 10 μM, vemurafenib—BRAF inhibitor 10 μM, dasatinib—SRC inhibitor 1 μM, FLLL31—STAT3 inhibitor 10 μM, LY294002—AKT inhibitor 15 μM, and JSH23—NF-kB inhibitor 5 μM on imiquimod-induced VEGF-A release inhibition. Data are represented as mean ± SD of three independent experiments. * p < 0.05 compared to untreated cells. § p < 0.05 compared to imiquimod-treated cells.

