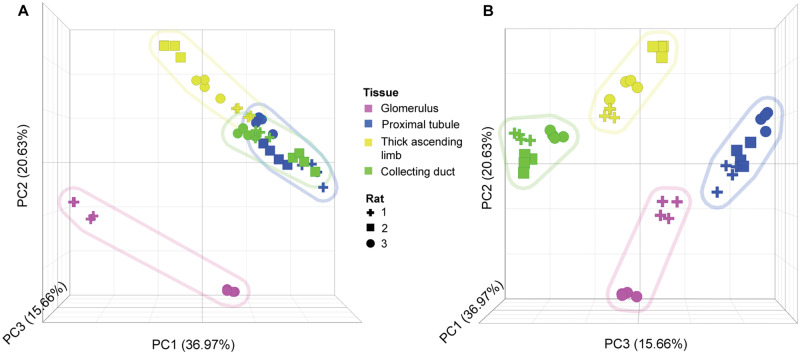
Figure 6.
Principal component analysis of sRNA-seq normalized microRNA counts in nephron segments isolated by laser capture microdissection (LCM) in Sprague Dawley rats. A, Principal component 1 (PC1; x-axis) and PC2 (y-axis) view. B, PC3 (z-axis) view. First 3 PCs shown, representing 73% of the total variance. Each data point represents different sequencing lanes. Shapes designate individual rat samples. Colors represent different nephron regions (see key). Colored shaded regions represent groupings of each nephron segment sampled via LCM.

