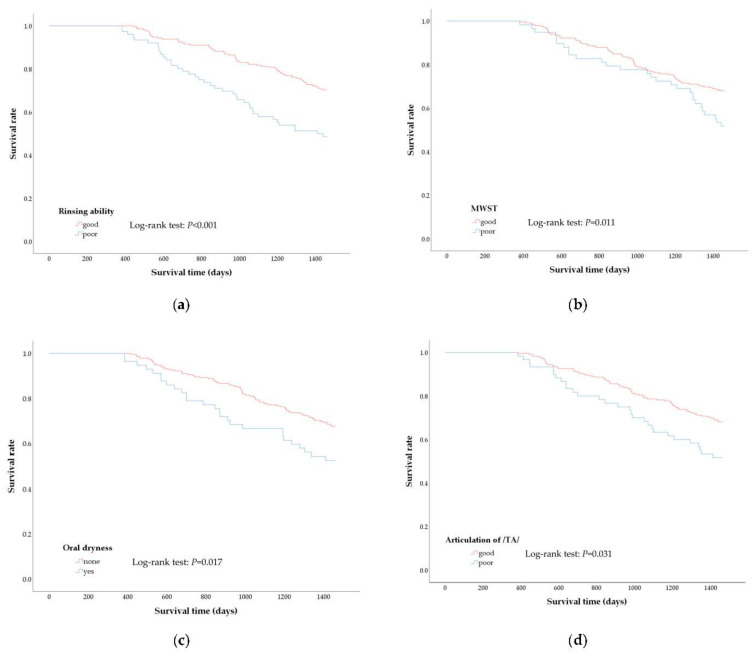
Figure 2.
Kaplan–Meier curves and results of Log-rank test between poor and good oral function group. Kaplan-Meier curves represent the difference in survival rate according to oral function as assessed by rinsing ability (a), modified water swallowing test (b), oral dryness (c), and articulation of /Ta/ (d) during the 4-year observational period.

