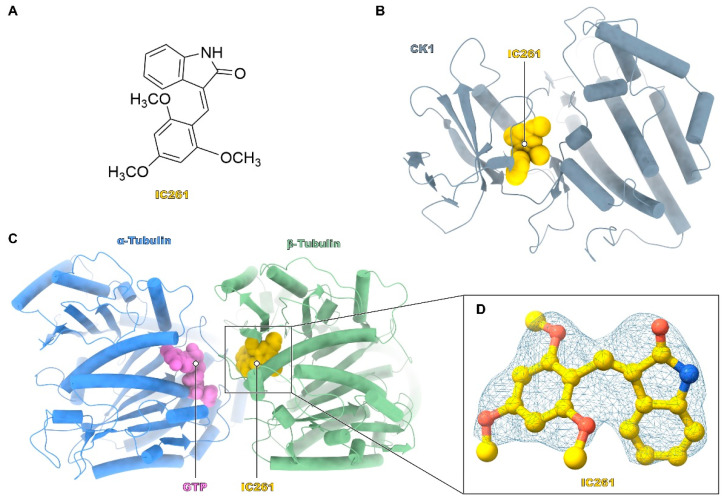
Figure 1.
Crystal structure of IC261 complexed with casein kinase 1 (CK1) and tubulin. (A) Chemical formula of IC261. (B) Binding mode of the CK1-IC261 complex structure. The CK1 is shown in grey and IC261 in yellow. (C) The overall structure of tubulin-IC261 complex. The α-tubulin is shown in blue, β-tubulin in green, guanosine triphosphate (GTP) in purple, and IC261 in yellow. (D) The electron densities of IC261. The Fo-Fc map is shown grey and contoured at 2.0 σ.

