Figure 2.
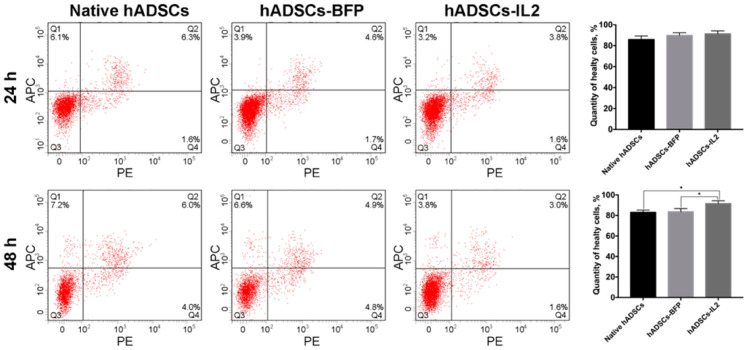
Viability analysis of native and genetically modified hADSCs. Cells were cultured for 24 and 48 h and stained with Annexin/PI to detect apoptosis and necrosis. Data were obtained using flow cytometry. Q1: number of apoptotic cells. Q2: number of late-apoptotic cells. Q3: number of healthy cells. Q4: number of necrotic cells. Each box represents the mean ± SD (n = 6) of two biological replicates of the number of healthy native hADSCs, hADSCs-BFP or hADSCs-IL2. * p < 0.05.

