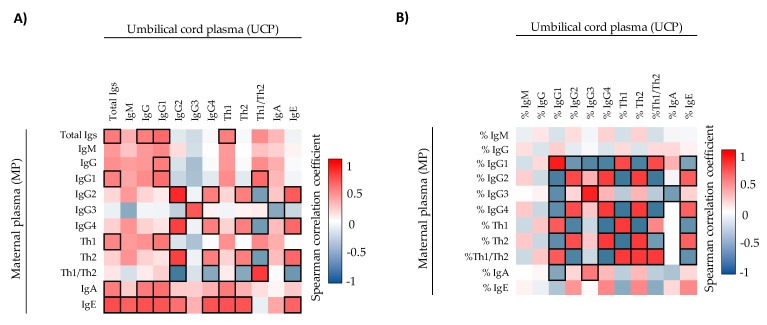
Figure 2.
Correlations between the Ig concentrations (A) and the Ig relative percentages (B) present in umbilical cord plasma and maternal plasma (n = 17). The Spearman correlation coefficient is represented in the heat map following the color in the legend. Bold frames represent correlations with statistical significance (p < 0.05). MP, maternal plasma; UCP, umbilical cord plasma. IgG1, IgG2, and IgG3 (Igs associated with a Th1 response); IgG4 (Ig associated with a Th2 response) [30,31].

