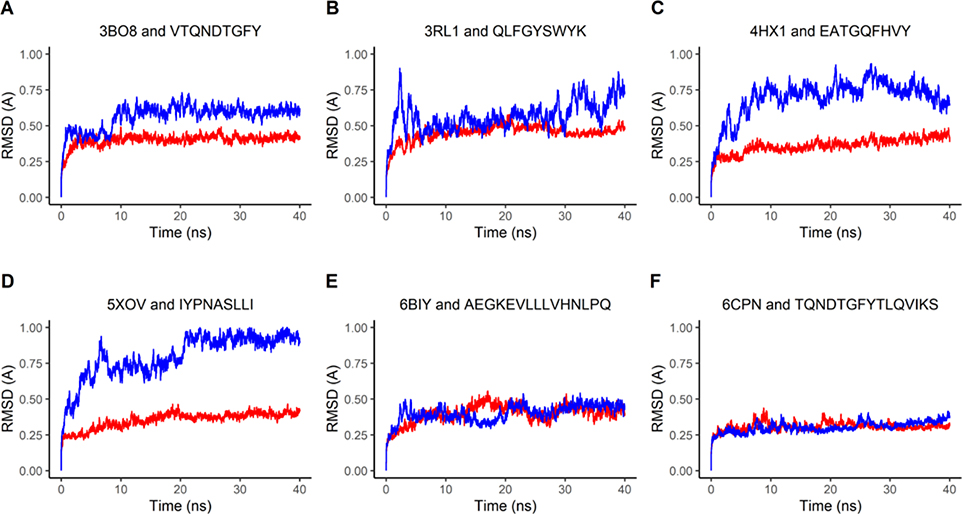
Figure 7: Molecular Dynamics represented through RMSD Plots.
The red-colored lines plot RMSD values of the HLA molecule from six complex structures bound with the original peptide ligand found in PDB, while the blue-colored lines plot the RMSD values of the HLA molecule in the complex bound with the predicted epitopes. The six complex structures found in PDB include four MHC Class I antigens (A-D, see Table 1) and two MHC Class II antigens (E-F, see Table 2).

