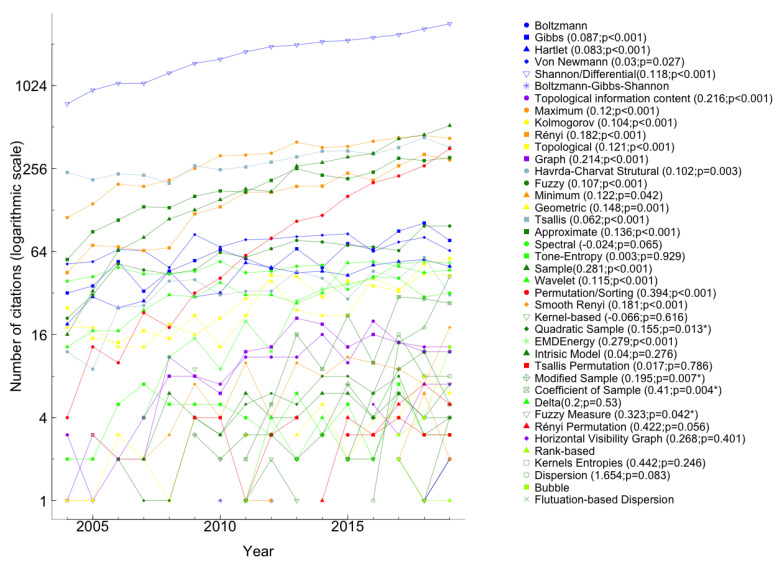
Figure 12.
Number of citations by year in Scopus between 2004 and 2019 of the papers proposing each measure of entropy, in logarithmic scale (). In the legend, the ordered pair (, p-value), in papers cited in more than three years, corresponds to the slope of the regression line, , and the respective p-value. Statistically significant slopes () are marked with *.

