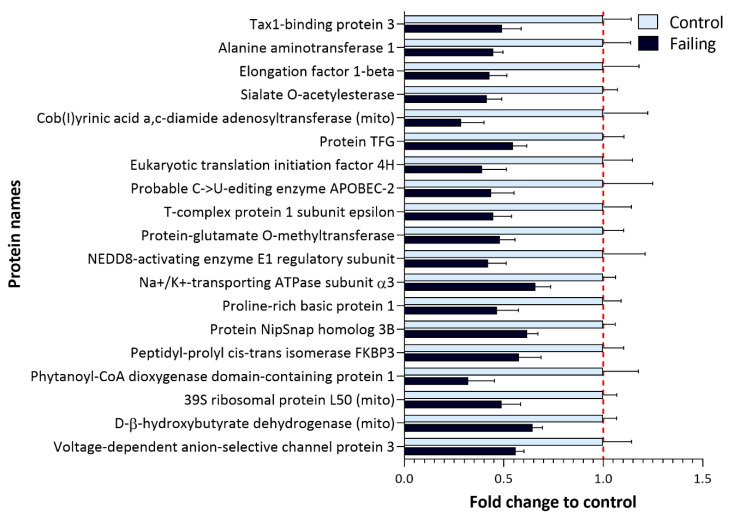
Figure 6.
Proteins with a significantly lower expression in failing hearts compared to nonfailing control samples. Bar plot representing fold change in the expression of significantly less expressed proteins in failing hearts (Figure 4A, left side of the volcano plot) which include several metabolic enzymes as well as proteins implicated in protein translation and ion transport (FDR-corrected p-value < 0.05, fold change (failing/control hearts) <0.7).

