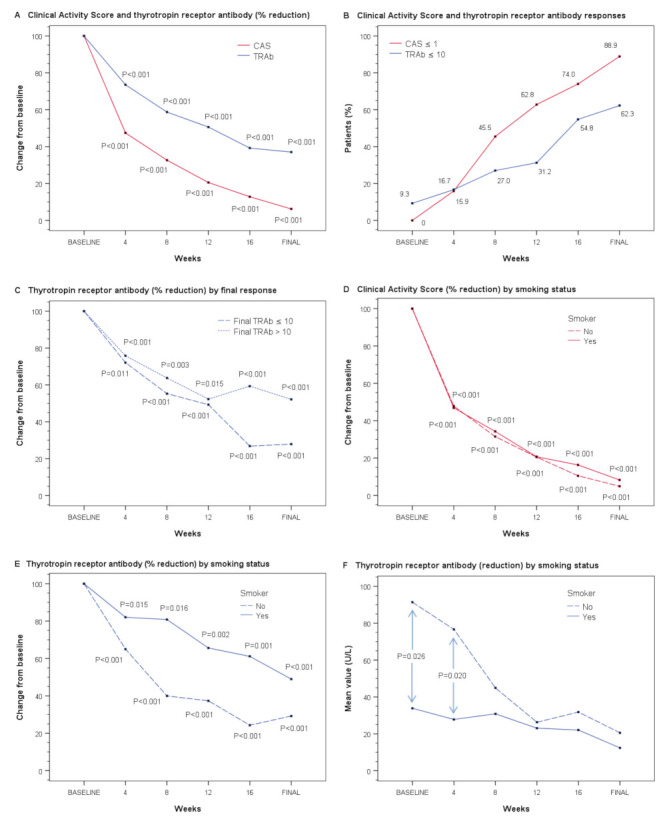
Figure 1.

Main effectiveness outcomes during the course of the treatment with tocilizumab. (A) Panel A shows the rate of reduction in the Clinical Activity Score (CAS) and thyrotropin receptor antibody (TRAb) level as the mean percentage changes from baseline (mean relative percentage values are shown to facilitate interpretation, while p-values were calculated with the Wilcoxon test using the medians of the absolute values of the measurements). CAS and TRAb values correspond to measurements at baseline and at one month after each treatment dose. (B) Panel B shows the responses with regard to CAS (defined as CAS ≤ 1) and TRAb (defined as TRAb ≤ 10 U/L) throughout the treatment period (CAS and TRAb responses by smoking status can be seen in Figure S1A,B). (C) Panel C shows the mean percentage change in TRAb from baseline according to the final TRAb response. (D,E) Panels D and E show the rate of reduction in CAS and TRAb, respectively, according to smoking status. (F) Panel F shows the mean TRAb levels in smokers and non-smokers; comparisons between groups were performed with the Mann–Whitney U test. (The mean CAS reduction by smoking status can be seen in Figure S1C). The p-values shown in panels C, D, and E were calculated with the Wilcoxon test using the medians of the absolute values of the measurements.
