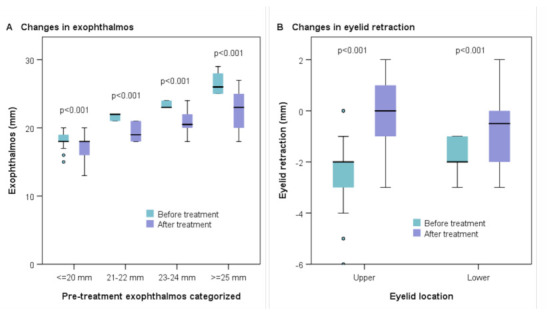
Figure 2.

Exophthalmos and eyelid retraction before and after treatment with tocilizumab. The box plots show the changes in exophthalmos (categorized in four groups based on the initial measurement of exophthalmos) (A) and eyelid retraction (upper and lower) (B) before and after treatment with tocilizumab. P-values were calculated with the Wilcoxon test.
