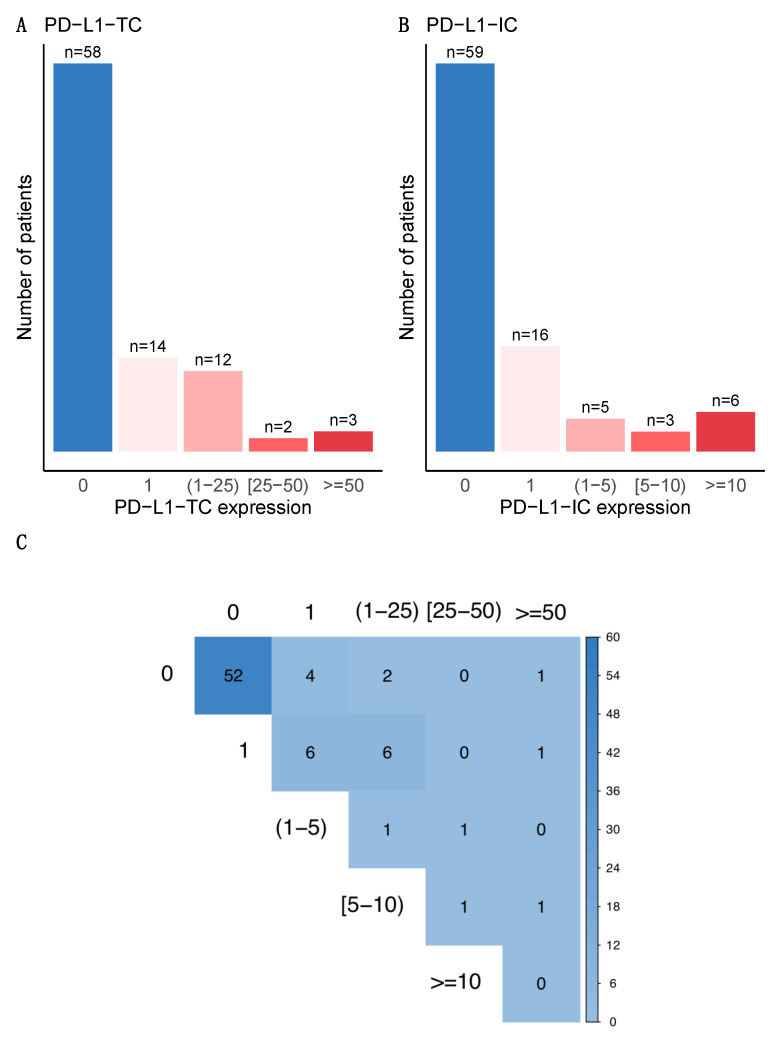
Figure 1.
Bar plot distribution of PD-L1 expression after NAC (A) on tumor cells and (B) on immune cells. (C) Correlation plot of PD-L1 expression between tumor cells and immune cells. PD-L1 positivity was defined as expression by ≥1% of the cells (being the 1% included) for both tumor and immune cells. PD-L1 expression were also binned: on tumor cells/0%, 1%, (1–25%), (25–50%) and ≥50%, and on immune cells/0%, 1%, (1–5%), (5–10%) and ≥10%.

