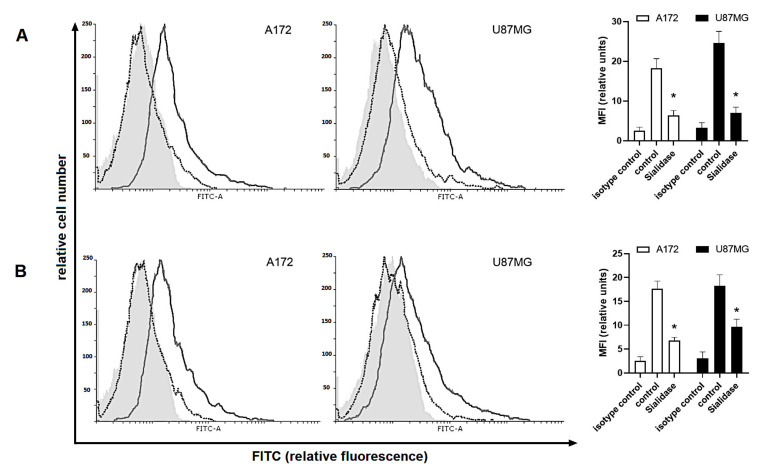
Figure 8.
Binding of (A) Siglec-5/Fc and (B) Siglec-11/Fc fusion proteins to glioma cells digested with α2-3,6,8-neuraminidase. Representative histograms and corresponding bar graphs show isotype control (light grey filled histogram), control cells (grey line) and sialidase—treated cells (black dotted line). Data are presented as a median fluorescence intensity (MFI) from at least three independent experiments done in duplicate; * p < 0.05 vs. corresponding control group.

