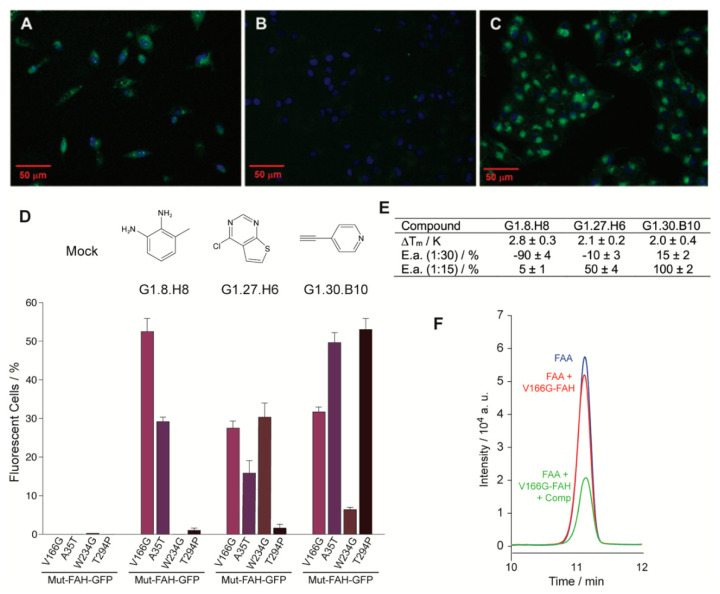
Figure 2.
Eukaryotic and in vitro assays for a selected set of compounds. (A–C) Representative fluorescence microscopy images for the eukaryotic cellular assay. M1 cells incubated with (A) the proteasomal inhibitor MG132, (B) a compound of the library showing no effect on FAH homeostasis and (C) a compound that increases protein accumulation in the cytosol. (D) Percentage of positive cells for a set of selected compounds and for the four different mutant constructs under consideration: V166G-FAH-GFP, purple bars; A35T-FAH-GFP, violet bars; W234G-FAH-GFP, brown bars and T294P-FAH-GFP, black bars. (E) Change in the thermal stability (Tm) for the selected set of compounds and percentage of inhibition or activation as compared to the reference reaction for the set of compounds in the enzyme activity assay (E.a.), in the presence of 15 and 30 equivalents of a given compound as indicated. Error bars are obtained from triplicate measurements. (F) Region of the HPLC chromatogram corresponding to the fumaryl acetoacetate (FAA) elution. Legend: control experiment without enzyme (blue line), enzymatic reaction (red line), enzymatic reaction in the presence of compound (green line).

