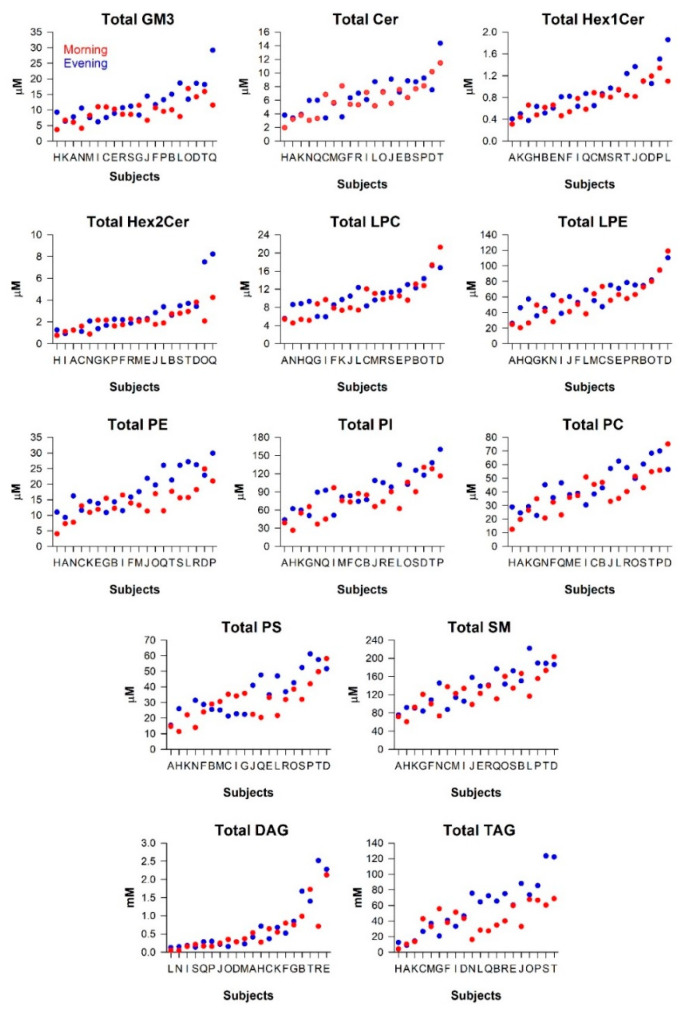
Figure 3.
Individual differences in concentrations of human milk lipids. Lipid concentrations in morning (red) and evening (blue) milk samples are shown for 20 women. The data in each plot are ordered from left to right by the average concentration values of morning and evening samples in each participant.

