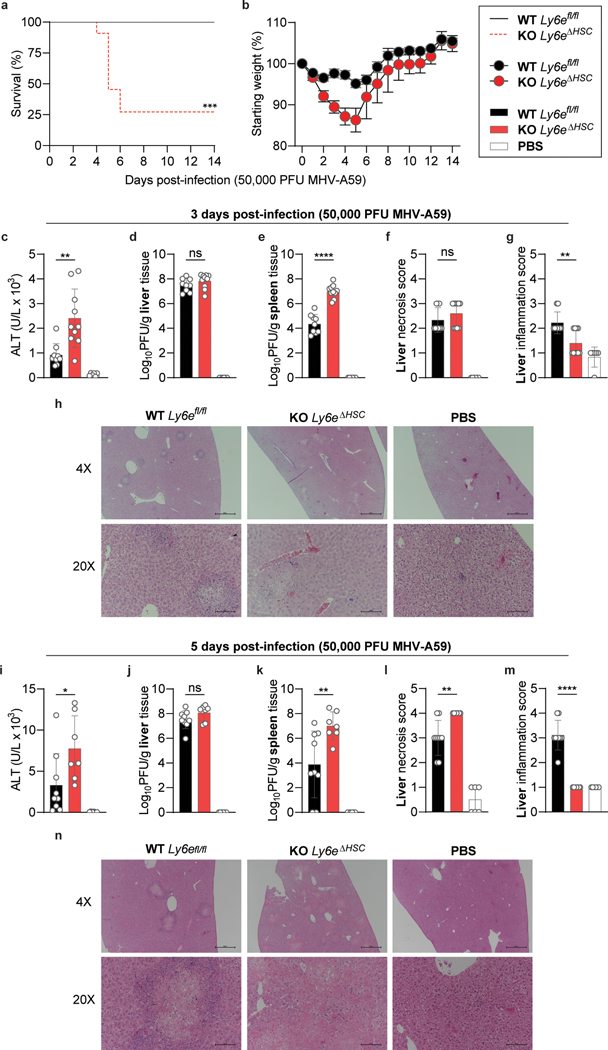
Figure 3. Ly6eΔHSC mice are more susceptible to mouse hepatitis virus.
a-b, Female Ly6efl/fl and Ly6eΔHSC mice were injected with PBS or MHV and monitored for survival (a) and weight loss (b). c-n, Mice were assessed at 3 (c-h) or 5 (i-n) days post-infection for serum ALT (c,i), viral titers in liver (d,j) and spleen (e,k), and liver necrosis and inflammation (f-h, l-n). For a-b, n=13 for days 0–14 (Ly6efl/fl), n=11 for day 0–3, n= 10 for days 4–5, n=5 for days 5–6, n=3 for days 6–14 (Ly6eΔHSC) from three pooled experiments. For c-g, data represents mean value of n=9 (Ly6efl/fl), n=10 (Ly6eΔHSC), n=6 (PBS) from two pooled experiments; images in h are representative of the same cohorts. For i-m, data represents mean value of n=9 (Ly6efl/fl,), n=7 (Ly6eΔHSC), n=6 (PBS) from two pooled experiments; images in n are representative of the same cohorts. In h,n, scale bars are 500 μM (4x) and 100 μM (20x). Statistical significance was determined by two-sided Mantel-Cox test (a), two-tailed unpaired student’s t-test with Welch’s correction (c-e, i-k), two-tailed Mann-Whitney U test (f-g, l-m). Data are presented as mean values ± SEM (b) or SD (c-g, i-m). P values: a, *** p=0.0002; c, ** p=0.0031; e, **** p=5.759 × 10⁻⁷; g, ** p=0.0054; i, * p=0.0430; k, ** p=0.0094; l, ** p=0.0072; m, **** p=8.741 × 10⁻⁵.

