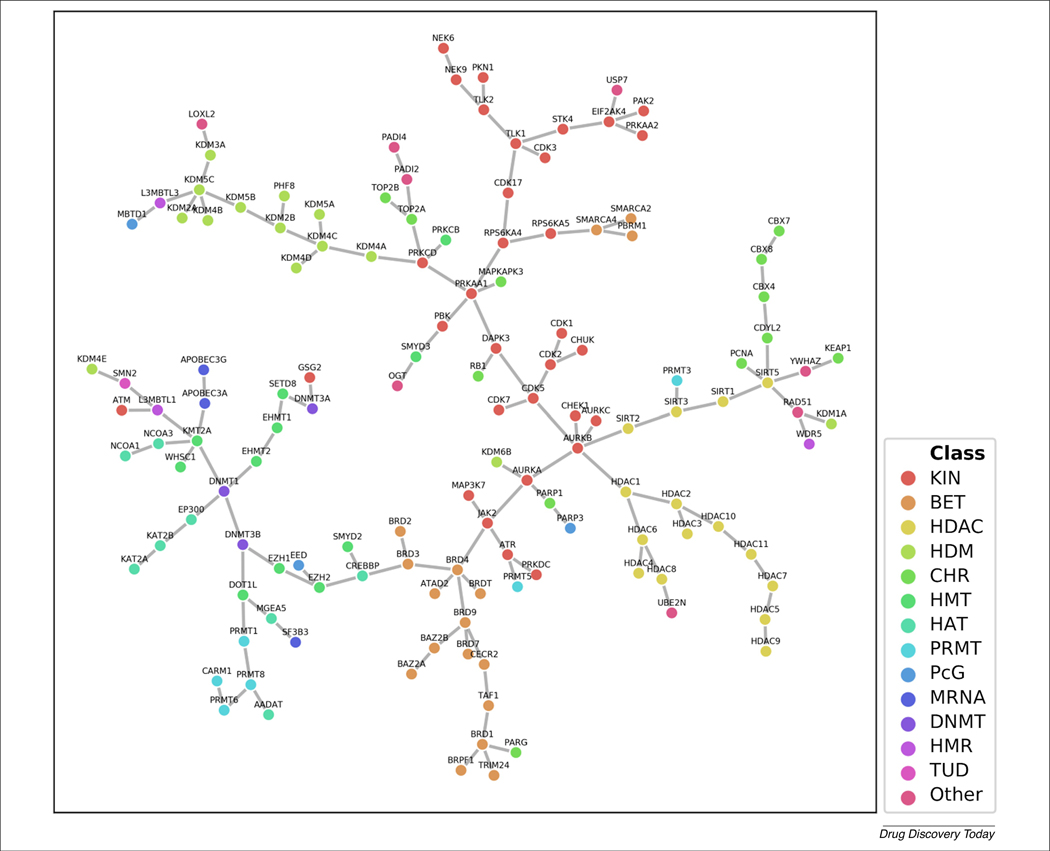
Figure 3.
Visual representation of the current epigenetics-relevant chemical space. The visualization was generated with the recent Tree Manifold Approximation and Projection method and Statistical-Based Database Fingerprints as condensed representations of compounds associated to the epigenetic targets [31]. Individual nodes of the tree are epigenetic targets, colored by their class. The nodes are clustered according to the pairwise similarity of their condensed representations. The branches represent the connection between the chemical space of two different targets. Proximal data sets can contribute to the discovery of compounds acting on multiple targets. For definitions of abbreviations, please see the main text.

