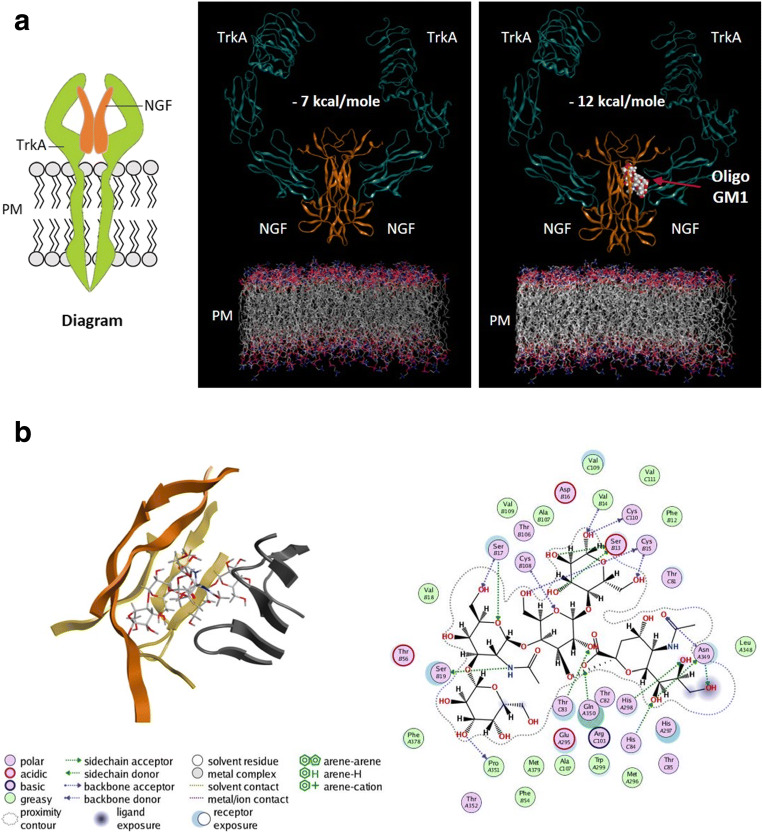
Fig. 5.
Molecular docking analyses of TrkA-NGF-OligoGM1 complex. a Diagram depicting the TrkA-NGF complex at cell surface and representation showing the TrkA-NGF interaction in absence (left) or in presence (right) of OligoGM1 as crystallographic complex. The binding energy associated to the TrkA-NGF complex is reduced from − 7 kcal/mol to -12 kcal/mol when OligoGM1 is present into the complex TrkA receptor is represented in magenta ribbons; NGF molecules in orange ribbons; OligoGM1 using space-filling model. b Representation of bonds between the extracellular residues of TrkA, NGF and OligoGM1

